iOS vs Android Market Share, Usage & App Revenue Statistics 2026

Android and iOS control virtually the entire mobile operating system market, but they dominate different parts of it.
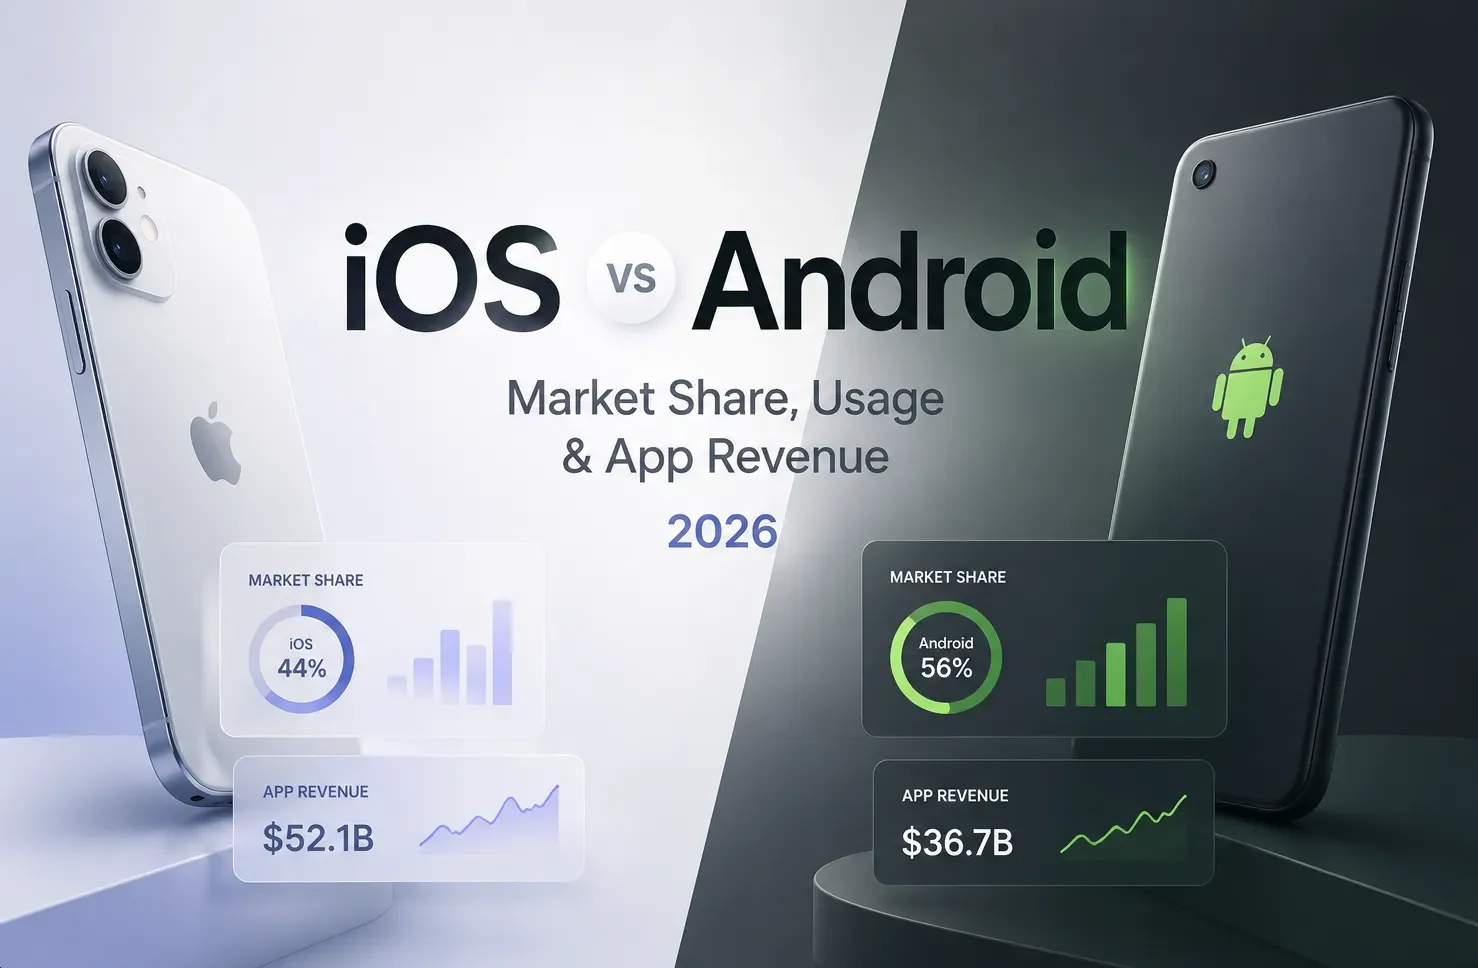
As of June 2026, Android holds 69.14% of the global mobile OS market share, while iOS accounts for 30.79%, according to StatCounter Global Stats.
Android leads in global usage, smartphone shipments and app downloads. iOS reaches fewer devices but generates most consumer app spending and maintains a majority share in several high-income markets, including the United States and Japan.
These consumer patterns are easier to interpret alongside mobile OS market share because platform mix shapes who can access a health app and how they use it.
The simplest way to understand the iOS vs Android market share split is:
Android wins on global reach and download volume. iOS wins on app revenue and monetization.
In 2025, Google Play generated approximately three times as many downloads as Apple’s App Store. Yet the App Store generated $117.6 billion in consumer spending, compared with $49.2 billion for Google Play, according to the Business of Apps App Data Report.
This report covers the latest Android market share, iOS usage, smartphone shipments, app revenue, app availability and operating-system fragmentation statistics for 2026.
Alongside download totals, iOS vs Android market share helps explain how platform reach and fragmentation shape acquisition opportunities.
The comparison in iOS vs Android market share statistics helps separate platform-level differences in usage, revenue, availability, and fragmentation.
It provides the platform context needed to interpret gaming differences across iOS and Android market-share and app-revenue statistics.
Use iOS versus Android market-share and usage statistics to distinguish platform conditions from broader smartphone behavior.
That distinction matters when iOS vs Android market share shapes regional monetization and distribution assumptions.
To compare platform splits with the broader market, use full 2025 mobile app revenue report, which adds context for interpreting monetization differences.
Key iOS vs Android statistics
Android holds 69.14% of the global mobile OS market share.
iOS holds 30.79% of worldwide mobile OS usage.
Android and iOS together account for more than 99.9% of the mobile operating system market.
The App Store generated $117.6 billion in consumer spending in 2025.
Google Play generated $49.2 billion in consumer spending.
Apple captured approximately 70.5% of combined App Store and Google Play consumer spending.
Google Play generated approximately three times as many app downloads as the App Store.
Global consumer app spending reached $167 billion in 2025, up 10.6% year over year.
Apple reported more than 2.5 billion active Apple devices in January 2026.
Google’s latest official benchmark remains more than 3 billion active Android devices.
iOS holds 58.35% of mobile OS usage in the United States.
Android holds 93.05% of mobile OS usage in India.
Apple shipped 247.8 million iPhones in 2025 and became the world’s largest smartphone vendor by annual shipments.
Two iOS versions cover approximately 93% of active iPhones.
Android requires roughly seven major versions to reach comparable usage coverage.
The App Store ecosystem facilitated more than $1.4 trillion in developer billings and sales during 2025.

Get the Mobile Testing Playbook Used by 800+ QA Teams
Discover 50+ battle-tested strategies to catch critical bugs before production and ship 5-star apps faster.
iOS vs Android market share worldwide
When comparing platform opportunity, Google Play statistics help distinguish Android's store scale from its position relative to iOS.
According to StatCounter, the worldwide mobile operating system market share in June 2026 was:
Mobile operating system | Global market share |
Android | 69.14% |
iOS | 30.79% |
Other operating systems | Less than 0.1% |
Android is therefore used by more than twice as many active mobile devices as iOS globally.
However, these figures measure mobile web usage, not smartphone sales or unique users. StatCounter calculates market share using page views generated by devices accessing websites in its measurement network.
This distinction matters because several different metrics are commonly described as “market share”:
Usage share: Devices actively generating web traffic
Shipment share: New smartphones shipped during a given period
Installed base: Devices reported as active by Apple or Google
Sales share: Smartphones sold during a quarter or year
User share: Unique people using each platform
These metrics should not be used interchangeably.
For example, Apple represented approximately 20% of smartphone shipments in 2025 but around 31% of active mobile OS usage in June 2026. Both figures can be accurate because iPhones often remain active for several years after their original purchase.
Mobile operating system market share over time
Android overtook iOS globally around 2012 and has remained the leading mobile operating system ever since.
Android’s global usage share peaked at roughly 75% to 76% in 2019. Since 2020, the mobile operating system market share has become relatively stable:
Android has generally remained between 69% and 72%
iOS has generally remained between 25% and 31%
All other mobile operating systems combined account for less than 1%

The mobile market is no longer divided among several serious operating-system competitors. Android and iOS have effectively formed a global duopoly.
This stability does not mean the competition is over. Instead, the two platforms have settled into different positions:
Android dominates global device reach.
iOS has a disproportionately strong position in premium markets and app spending.
Android is distributed across hundreds of manufacturers.
iOS is controlled entirely by Apple.
A historical chart should use one consistent month for every year. Mixing annual averages, quarterly shipment data and monthly usage data would create a misleading trend.
Android and iOS market share by country
The global iOS vs Android market share split varies sharply by country.
iOS leads in several mature, higher-income smartphone markets. Android dominates most emerging markets, where a wider range of manufacturers and device prices makes the platform more accessible.
Market | Android market share | iOS market share | Leading platform |
Worldwide | 69.14% | 30.79% | Android |
United States | 41.62% | 58.35% | iOS |
Japan | 41.24% | 58.74% | iOS |
China | 70.52% | 29.13% | Android |
India | 93.05% | 6.86% | Android |
Europe | 60.99% | 38.98% | Android |
Sources: Worldwide, United States, Japan, China, India and Europe. Figures reflect StatCounter mobile usage data for June 2026. Minor platforms and unidentified traffic account for small differences from 100%.
iOS vs Android market share in the United States
iOS controls 58.35% of US mobile operating system usage, compared with 41.62% for Android, according to StatCounter’s US data.
The United States is one of Apple’s strongest major markets. Carrier financing, higher average purchasing power, long device-retention periods and Apple’s wider hardware ecosystem all contribute to the iPhone’s majority position.
For companies targeting US consumers, iOS can represent both the larger active audience and the platform with stronger monetization potential.
iOS vs Android market share in Japan
Japan has a similar platform split:
iOS: 58.74%
Android: 41.24%
Japan is unusual within Asia because iOS holds a clear majority. In most other large Asian markets, Android dominates mobile OS usage.
Source: StatCounter Japan mobile OS market share.
Android market share in India
India is one of the world’s most Android-dominant major smartphone markets.
Android holds 93.05% of mobile OS usage in India, while iOS accounts for only 6.86%, according to StatCounter India.
Android’s advantage comes from the wide availability of affordable devices across Samsung, Xiaomi, vivo, Oppo, Realme, Transsion and other manufacturers.
For India-focused mobile products, Android cannot be treated as one uniform platform. Teams often need to support a broad range of:
Device prices
Manufacturers
Android versions
Screen sizes
Chipsets
Memory and performance levels
Android and iOS market share in China
Android accounts for 70.52% of mobile OS usage in China, while iOS holds 29.13%, according to StatCounter China.
However, China’s Android ecosystem differs from most international markets because Google Play is not the primary app-distribution channel. Android apps are distributed through several manufacturer-owned and third-party app stores.
As a result, Android market share in China should not be treated as equivalent to Google Play market share.
How many active Android and Apple devices are there?
Apple and Google publish active-device figures, but the totals are not directly comparable.
Apple active devices
Apple reported more than 2.5 billion active Apple devices worldwide in January 2026.
This figure includes all active Apple products, such as:
iPhones
iPads
Macs
Apple Watches
Apple TVs
Other Apple devices
It does not mean Apple has 2.5 billion unique users or 2.5 billion active iPhones. One person can own several active Apple devices.
Apple has previously stated that more than one billion iPhones are active worldwide, but it does not regularly publish an updated iPhone-only installed-base figure.
Source: Apple’s fiscal Q1 2026 results.
Android active devices
Google’s latest official benchmark remains more than 3 billion active Android devices across over 190 countries.
Third-party estimates place the active Android installed base closer to 3.9 billion devices in 2025, but Google has not officially confirmed that estimate.
The Apple and Android numbers should therefore be understood as active-device indicators, not like-for-like smartphone-user counts.
Sources: Google’s 3-billion-device announcement reported by TechCrunch and the more recent third-party estimate from DemandSage.
Smartphone market share and shipments
Worldwide smartphone shipments reached approximately 1.26 billion units in 2025, representing 1.9% year-over-year growth.
Apple became the world’s largest smartphone manufacturer by annual shipments:
Smartphone vendor | 2025 shipments | Smartphone market share |
Apple | 247.8 million | 19.7% |
Samsung | 241.2 million | 19.1% |
Xiaomi | 165.3 million | Approximately 13.1% |
Other vendors | Approximately 605 million | Remaining market |
Source: IDC shipment data, as summarized in GSMArena’s report on the final 2025 market results.
Apple’s first-place position does not mean iOS overtook Android.
Apple is the only company selling iOS phones. Android is used by Samsung, Xiaomi, Oppo, vivo, Transsion, Realme, Google and hundreds of smaller manufacturers.
When all Android manufacturers are combined, Android devices still account for roughly four out of every five smartphones shipped.
This is why smartphone vendor market share and mobile OS market share must be treated as separate datasets.
App revenue: App Store vs Google Play
The biggest difference between Android and iOS appears in app revenue.
Combined consumer spending across Apple’s App Store and Google Play reached approximately $167 billion in 2025, up 10.6% year over year, according to Sensor Tower’s State of Mobile 2026.
For the annual download context behind that spending figure, mobile app download statistics show how volume and market split shape the comparison.
This included paid app purchases, subscriptions and in-app purchases.
App marketplace | 2025 consumer spending | Share of two-store app revenue |
Apple App Store | $117.6 billion | 70.5% |
Google Play | $49.2 billion | 29.5% |
Combined | $166.8 billion | 100% |
Source for the platform split: Business of Apps App Data Report.
The small difference between the $166.8 billion platform total and Sensor Tower’s rounded $167 billion industry figure is caused by rounding.
Apple’s App Store generated approximately 2.4 times as much consumer app revenue as Google Play, despite Android controlling more than twice as much global mobile usage.
This does not mean every iOS app earns more than its Android equivalent. App revenue varies significantly by:
Country
App category
Business model
Subscription pricing
User demographics
Payment infrastructure
App-store availability
At the total market level, however, the monetization gap remains clear.
Android provides the larger potential audience. iOS produces significantly more consumer spending through its official app store.
App Store vs Google Play downloads
In practice, App Store and Google Play data provide only a partial view of banking-app distribution and engagement.
App downloads show the opposite pattern.
Google Play generated approximately three times as many downloads as Apple’s App Store in 2025, according to the Business of Apps App Data Report.
Available estimates place:
Google Play at roughly 110 billion to 113 billion downloads
The App Store at roughly 37 billion to 40 billion downloads
Combined downloads between approximately 142 billion and 153 billion
The totals vary because research providers treat reinstalls, regional distribution, preinstalled apps and other download activity differently.
The broader conclusion is consistent:
Google Play generates around three times the downloads, while the App Store generates around 2.4 times the consumer spending.
This creates two distinct platform opportunities:
Platform | Primary advantage |
Android | Global reach and download volume |
iOS | App revenue and monetization |
Both | Near-complete global smartphone coverage |
For mobile businesses, the right platform priority depends on whether the immediate goal is audience scale, revenue efficiency or both.

Why Apple’s App Store ecosystem is worth $1.4 trillion
Apple reported that the App Store ecosystem facilitated more than $1.4 trillion in developer billings and sales during 2025.
This number is often confused with App Store app revenue, but it measures a much broader economy.
App Store ecosystem category | 2025 billings and sales |
Physical goods and services | $1.1 trillion |
Digital goods and services | $149 billion |
In-app advertising | $151 billion |
Source: Apple’s App Store ecosystem report.
The physical-goods figure includes purchases and transactions initiated through iOS apps, such as:
Retail orders
Food deliveries
Travel bookings
Transport services
Marketplace purchases
The $1.4 trillion figure is therefore not Apple revenue and should not be directly compared with the App Store’s $117.6 billion in consumer app spending.
Apple estimates that more than 90% of the $1.4 trillion flowed to developers and businesses without an App Store commission.
App availability on iOS and Android
As of July 29, 2026, 42matters tracked:
App store | Available apps |
Apple App Store | 2,501,193 |
Google Play | 2,476,977 |
The two app stores now contain a similar number of publicly available applications.
App-store catalog figures can change daily because:
New apps are continuously published
Inactive apps are removed
Regional listings may be counted differently
Games may be separated from other apps
Low-quality and policy-violating apps are periodically deleted
Google Play has removed a significant number of low-quality and inactive applications since 2024 as it introduced stricter catalog requirements.
For this reason, app availability figures should always include a clearly visible “last checked” date.
Last checked: July 29, 2026.
iOS vs Android version adoption
The difference between iOS and Android becomes even more pronounced when comparing operating-system version adoption.
Apple controls both iOS and the hardware it runs on. Android updates move through a more complicated chain involving:
Google
Chip manufacturers
Device manufacturers
Mobile carriers
Regional release schedules
This creates a much longer Android version tail.
iOS version adoption
According to Apple’s developer telemetry, measured on June 7, 2026:
iOS version | Share of active iPhones |
iOS 26 | 79% |
iOS 18 | 14% |
Earlier versions | 7% |
Among iPhones introduced within the previous four years, iOS 26 adoption reached 86%.
Apple calculates these figures using devices that completed App Store transactions.
Android version market share
According to StatCounter’s June 2026 Android version data:
Android version | Usage share |
Android 16 | 23.83% |
Android 15 | 17.25% |
Android 13 | 14.26% |
Android 14 | 12.68% |
Android 12 | 9.88% |
Android 11 | 7.94% |
Android 10 and older | Approximately 14.2% |
The latest iOS version is used by almost four out of every five active iPhones.
By comparison, the most-used Android version accounts for less than one-quarter of Android usage.

Apple and StatCounter use different measurement methodologies, so the percentages are not perfectly equivalent. Apple uses App Store activity, while StatCounter uses mobile web traffic.
Even with that limitation, the difference in version concentration is substantial.
How many Android and iOS versions must apps support?
Operating-system fragmentation directly affects mobile development and testing.
Approximate active-usage coverage | iOS versions required | Android versions required |
Around 80% | 1–2 | Approximately 6 |
Around 90% | 2 | Approximately 7 |
Around 95% | Approximately 3 | Approximately 8–9 |
Two iOS versions cover approximately 93% of active iPhones.
Android requires roughly seven major versions to reach comparable usage coverage. Older Android versions also remain more common in emerging markets and on lower-cost devices.
The number of OS versions is only one part of Android fragmentation. Teams must also account for:
Device manufacturers
Screen sizes and resolutions
Chipsets
Memory limitations
OEM interfaces
Permission behaviour
Background-process restrictions
Keyboard behaviour
System dialogs
Camera and sensor hardware
This is why Android testing usually requires a broader device matrix than iOS testing.
Android device fragmentation
The last comprehensive public count of Android device models was published by OpenSignal in 2015.
The study identified:
24,093 distinct Android device models
1,294 manufacturers
Approximately 682,000 devices in the dataset
Source: OpenSignal data reported by VentureBeat.
This figure should not be presented as the number of Android models available in 2026. It is more than a decade old.
Instead, it should be treated as a historical baseline showing that Android fragmentation was already substantial by 2015. No current public source publishes a directly comparable comprehensive model count.
Samsung remains the largest Android manufacturer, representing approximately 31.5% of Android vendor usage in 2026. Xiaomi follows at approximately 15.9%, while vivo, Oppo, Transsion, Realme and other manufacturers form a long tail.
The Android testing challenge is therefore not limited to supporting Samsung phones. It includes multiple hardware families, OEM interfaces, screen sizes and system-level behaviours.
Developer platform usage
Swift and Kotlin remain the primary native development languages for iOS and Android respectively.
However, cross-platform development is now a standard part of the mobile engineering landscape. The JetBrains State of Developer Ecosystem indicates that more than half of mobile developers use a cross-platform framework.
Among surveyed cross-platform developers:
React Native usage was approximately 35% to 36%
Kotlin Multiplatform usage reached approximately 18% in 2025
Sources: JetBrains Developer Ecosystem and Kotlin Multiplatform documentation.
Cross-platform frameworks can reduce duplicated application code, but they do not eliminate platform-specific testing requirements.
The same application can behave differently across iOS and Android because of differences in:
Permissions
Native UI components
Push notifications
System keyboards
Background execution
Deep links
Authentication
Payment systems
Hardware
App-store policies
A shared codebase reduces implementation duplication. It does not make iOS and Android identical environments.
iOS and Android enterprise adoption
There is no reliable current dataset showing a complete iOS vs Android enterprise market share split.
The commonly repeated claim that iOS controls 70% to 80% of enterprise devices comes from the Good Technology Mobility Index, which stopped publishing around 2015.
In Q4 2014, Good Technology reported:
iOS: 73% of enterprise device activations
Android: 25%
Other platforms: Approximately 2%
Source: Computerworld’s coverage of the Good Technology Mobility Index.
This is useful historical context but should not be presented as current enterprise market share.
More recent indicators show that both platforms have substantial enterprise adoption:
Jamf manages more than 30 million Apple devices across more than 70,000 organizations.
Apple has stated that every Fortune 500 company uses Apple products in some capacity.
Jamf added Android device management in 2025 after historically concentrating on Apple hardware, as reported by Computerworld.
These indicators demonstrate enterprise usage but do not establish a current platform-share percentage.
What iOS vs Android market share means for mobile testing
Adding mobile-platform context helps teams translate market-share differences into practical device and test-coverage priorities.
Use mobile testing statistics and device-matrix evidence to prioritize platform coverage around the devices and audiences your release actually serves.
Device-matrix priorities should also reflect regional fintech adoption patterns since market momentum can vary by region independently of platform share.
The market-share data creates a clear product and QA requirement: most consumer mobile teams cannot ignore either operating system.
Android accounts for approximately 69% of worldwide mobile OS usage. An iOS-only app therefore excludes most of the global smartphone audience.
iOS accounts for approximately 31% of usage, but the App Store generates around 70.5% of combined App Store and Google Play consumer spending. An Android-only app can therefore exclude a disproportionate share of app revenue.
The 2026 app store statistics report adds catalog, download, and enforcement context to that revenue split.
The two platforms represent different business opportunities:
Android provides greater global reach
iOS provides stronger consumer monetization
Android requires broader device and OS-version coverage
iOS users adopt recent versions much faster
The correct testing matrix depends heavily on geography
A US-first mobile app should prioritize recent iPhone models while maintaining coverage across leading Android manufacturers.
An India-first product requires much deeper Android coverage across price tiers, manufacturers, screen sizes and older operating-system versions.
The global Android market share is useful for strategy, but it is not enough for building a test matrix. Teams should select devices using country-specific data for:
Mobile OS usage
Android versions
Device manufacturers
Screen resolutions
Hardware performance
Revenue contribution
Why Android creates the larger testing surface
A team targeting approximately 90% usage coverage may need to validate:
Around two major iOS versions
Around seven Android versions
Several Android manufacturers
Multiple screen sizes and hardware profiles
OEM-specific system behaviour
That larger Android matrix creates more opportunities for regressions and inconsistent user experiences.
Quash helps mobile teams automate Android test flows using plain-English instructions, reducing the amount of brittle test code required to maintain broad Android coverage.
iOS vs Android market share FAQ
Which has more market share in 2026, iOS or Android?
Android has the larger worldwide mobile OS market share. As of June 2026, Android holds 69.14% of global mobile usage, compared with 30.79% for iOS, according to StatCounter.
What is the Android market share worldwide?
Android accounts for 69.14% of global mobile operating system usage as of June 2026.
What is the iOS market share worldwide?
iOS accounts for 30.79% of global mobile operating system usage as of June 2026.
Is iOS or Android more popular in the United States?
iOS is more popular in the United States. It holds 58.35% of US mobile OS usage, compared with 41.62% for Android.
Is iOS or Android more popular in India?
Android dominates India, accounting for 93.05% of mobile OS usage. iOS holds approximately 6.86%.
Which platform generates more app revenue?
Apple’s App Store generates more consumer app revenue. In 2025, the App Store generated approximately $117.6 billion, compared with $49.2 billion for Google Play.
Which app store has more downloads?
Google Play generates approximately three times as many downloads as Apple’s App Store.
Does Android or iOS have more apps?
The two platforms have a similar number of apps. As of July 29, 2026, 42matters tracked approximately 2.50 million App Store apps and 2.48 million Google Play apps.
Is Android more fragmented than iOS?
Yes. Approximately two iOS versions cover 93% of active iPhones, while Android requires roughly seven major versions to reach similar usage coverage.
Should mobile apps support both iOS and Android?
Most consumer mobile apps should eventually support both. Android provides the majority of global reach, while iOS generates most consumer app spending. The correct launch and testing priority depends on the target market, audience and business model.
Platform differences in reach and consumer spending make iOS vs Android market share and revenue trends useful context when assessing how dating apps reach and monetize users.
Methodology
This report combines several types of mobile-market data:
StatCounter: Mobile web-usage market share based on page views
Apple and Google: Self-reported active-device and operating-system telemetry
IDC and Counterpoint: Smartphone shipment estimates
Sensor Tower, Business of Apps and data.ai: Modelled app revenue and downloads
42matters: Live-crawled app-store catalog data
JetBrains: Developer survey data
Each dataset measures a different part of the mobile ecosystem.
Mobile OS market share, smartphone shipments, active devices, app downloads and unique users are not interchangeable metrics. Figures in this report are labelled according to what they measure and the period they cover.
Final takeaway
Android and iOS dominate different parts of the mobile economy.
Android leads on scale:
69.14% of global mobile OS usage
Roughly four-fifths of smartphone shipments
Approximately three times as many app downloads
Strong dominance across emerging markets
iOS leads on monetization:
70.5% of combined app-store consumer spending
Majority usage in the United States and Japan
Faster adoption of recent operating-system versions
A strong position in the premium smartphone segment
The practical conclusion is not that one platform has won.
Android provides reach. iOS provides concentrated app revenue. Supporting both platforms gives mobile teams access to nearly the entire global smartphone market, but the testing requirements are not symmetrical.
Android’s wider spread of devices, manufacturers and operating-system versions makes it the more complex side of the mobile testing matrix.
Continue reading
More articles from the Quash editorial desk.