Healthcare App Statistics (2026)

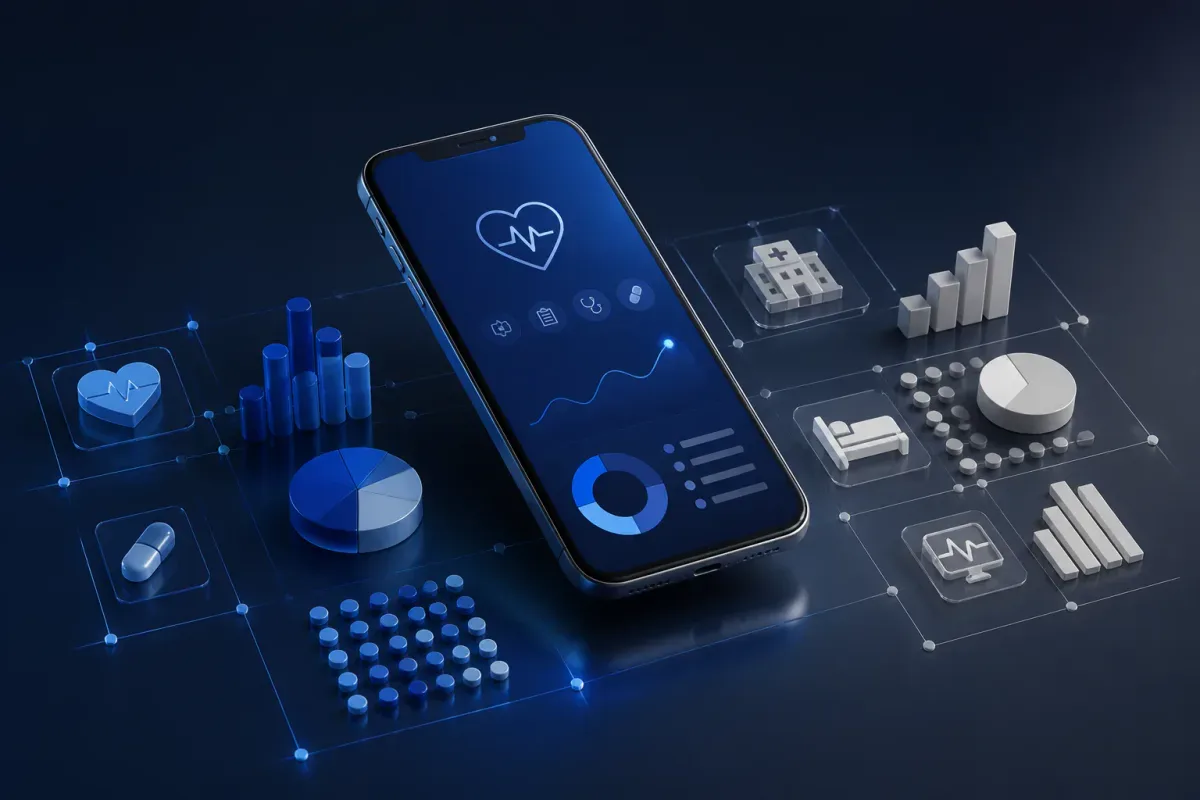
A healthcare app can mean the tool you use to check a lab result, a wellness tracker, a portal that aggregates records, or software subject to FDA device oversight. Put those into one spreadsheet column and the result will look more certain than it is.
The short answer: there is no defensible single global healthcare-app adoption rate for 2026. The most useful healthcare app statistics separate U.S. patient-portal access, hospital interoperability capability, broad consumer health-app use, and the narrower regulatory category of mobile medical software.
Healthcare app statistics at a glance
65% of U.S. individuals were offered and accessed their online medical record or patient portal in 2024. This HINTS measure captures people who were both offered access and accessed it; it is not a healthcare-app download or monthly-active-user rate. ASTP/ONC’s 2024 patient-access brief reports the result.
57% of U.S. individuals who accessed their online records used an app in 2024, compared with 38% in 2020 and 51% in 2022. The denominator is record or portal users, not all U.S. adults. The underlying data brief defines the app-access measure.
59% of U.S. individuals had multiple online medical records or patient portals in 2024. This is evidence of fragmented access across organizations, not a count of apps on a phone. ASTP/ONC’s HINTS analysis reports the measure.
7% of U.S. individuals used an app to organize information from different portals in 2024, up from 2% in 2022. This is a specific record-aggregation behavior, not a general health-app adoption rate. The 2024 HINTS brief provides the population and trend.
85% of U.S. non-federal acute-care hospitals reported that patients could electronically transmit information in a structured format in 2024. It is a hospital-reported capability, not patient usage. ONC’s hospital-engagement Quick Stat is the source.
About 87% of U.S. non-federal acute-care hospitals reported API-driven app access to medical information in 2024. The same Quick Stat describes capability at hospitals, not the number of people using an app. ONC’s Quick Stat uses this API-driven-access wording.
81% of U.S. non-federal acute-care hospitals enabled patient access using apps configured to meet API specifications in 2024. This is a different ONC capability definition from the 87% API-driven-app-access figure. ASTP/ONC’s hospital-capabilities brief reports the 81% measure.
70% of those hospitals enabled patient access using apps configured to meet FHIR specifications in 2024. This is a standards-based capability measure, not a patient-use rate. The same ASTP/ONC brief gives the FHIR definition.
71% of Americans used health apps in Reach3’s 2026 survey of 1,043 U.S. adults aged 18 and older. Reach3’s commercial survey uses a broad health-app category, so it cannot stand in for patient-portal or clinical-app adoption. Reach3’s May 2026 release states the result and sample.
58.5% of U.S. adults used the Internet to look for health or medical information during July–December 2022. This nationally representative CDC measure is dated Internet-use context, not current healthcare-app use. CDC’s NHIS Data Brief reports the field period and population.
41.5% of U.S. adults used the Internet to communicate with a doctor or doctor’s office during July–December 2022. It measures Internet use rather than use of a dedicated app. CDC’s NHIS Data Brief provides the estimate.

Get the Mobile Testing Playbook Used by 800+ QA Teams
Discover 50+ battle-tested strategies to catch critical bugs before production and ship 5-star apps faster.
Why there is no single healthcare-app adoption rate
The figures above answer different questions. A consumer survey asks whether a person reports using a broad category of health apps. A patient-access survey asks whether someone reached an online record. A hospital survey asks whether an organization can enable a function.
Those measures are related, but they cannot be added, averaged, or used as substitutes. An install is not an account; an account is not an active user; an active user is not a clinical transaction. Likewise, a hospital with an API does not establish that patients know about, connect to, or repeatedly use an app through that API.
For a deck, business case, or product plan, start with the question you need the number to answer. That choice determines the denominator you should carry with the statistic.
What a healthcare app statistic can count
Use these categories to keep your evidence aligned with the claim you are making:
Broad health-app use. This includes consumer-facing tools that a survey may group with wellness, sleep, activity, nutrition, fertility, or mental-health products.
Patient-portal access. This concerns medical records, results, messages, appointments, and provider or payer services. It can happen in a browser, an app, or both.
Interoperability use. This covers people using a service to bring information together from more than one portal or organization.
Hospital capability. This records what a hospital reports it can make available, including structured transmission and API-based access.
Regulated device software. This is a legal and functional category, not a synonym for every consumer health app.
One product may belong to more than one category. That does not make the underlying statistics interchangeable.
Patient-portal and record-app access in the United States
The strongest individual-level evidence in this set comes from ASTP/ONC’s 2024 HINTS analysis. Its 65% figure is useful when you need to show that patients were both offered and used online-record access in the United States. It is not the right figure when you need mobile-only behavior, because the measure does not treat browser access as app access. The owner-page brief explains the 2024 finding.
For mobile access, the more precise statistic is 57% of people who accessed their online records using an app. The qualifier matters: it describes app use within an already engaged portal-access population, rather than the share of every adult using a healthcare app.
The same data also make the fragmentation problem visible. 59% of U.S. individuals had multiple records or portals, while 7% used an app to combine information from different portals. The first figure describes the multi-organization reality many people face; the second describes the smaller group using a purpose-built aggregation tool.
If you are planning patient-facing flows, treat this distinction as a product constraint rather than a footnote. A feature designed for a single provider relationship is solving a different problem from one designed to help a person navigate multiple organizations.
Hospital capabilities and interoperability
Hospital measures tell you whether access can be enabled, not whether patients use it. ONC’s 2024 Quick Stat reports 85% of U.S. non-federal acute-care hospitals with structured electronic transmission for patients and approximately 87% with API-driven app access to medical information. The Quick Stat presents both capability measures.
A separate ASTP/ONC brief reports 81% of hospitals enabling access using apps configured to meet API specifications and 70% enabling it using apps configured to meet FHIR specifications. The hospital-capabilities analysis uses those more specific labels.
Do not select the largest percentage and call it the adoption rate. The 87%, 81%, and 70% figures describe related but distinct questions: API-driven access, apps configured to meet API specifications, and apps configured to meet FHIR specifications.
ONC’s February 2026 API brief uses another framing, reporting that approximately nine in ten hospitals enabled patient electronic access through an API and seven in ten used standards-based APIs such as HL7 FHIR in 2024. ONC’s API data brief should be cited when you use that specific wording.
The defensible conclusion is narrower: API and standards-based patient access were widespread capabilities at U.S. hospitals in 2024. The exact rate depends on the capability definition, and no hospital-capability statistic proves patient adoption.
Consumer health-app use and older digital-health context
Reach3’s 2026 result is the most current broad consumer-use signal in this evidence set: 71% of Americans reported using health apps in its commercial survey of 1,043 U.S. adults. Reach3’s research page describes its ongoing 2026 Digital Health Trends program.
Use that figure for broad, self-reported consumer health-app use and name the source. Do not use it to estimate the number of people accessing clinical records, receiving care through an app, or using FDA-regulated software.
The CDC’s older NHIS figures provide useful context for the behavior surrounding digital health. During July–December 2022, 58.5% of U.S. adults looked online for health or medical information, 41.5% communicated online with a doctor or office, and 46.1% looked up medical test results. CDC’s October 2023 brief identifies these as nationally representative Internet-use measures for that field period.
These are not 2026 app statistics. They show that digital health interactions were already common in a defined U.S. period, but they do not reveal whether the interaction happened in a mobile app, on the web, or through a portal.
Compliance, privacy, and quality signals
Not every healthcare app is FDA-regulated. FDA says a mobile app may fall within medical-device oversight when it meets the statutory device definition through its software functionality, acts as an accessory to a regulated device, or transforms a mobile platform into a regulated medical device. FDA applies a risk-based approach and exercises enforcement discretion for some lower-risk functions. FDA’s device-software guidance is the appropriate source for scope, rather than a consumer-app adoption survey.
Privacy rules also do not divide neatly into “HIPAA app” and “unregulated app.” In April 2024, the FTC finalized changes to its Health Breach Notification Rule, clarifying its application to health apps and similar technologies not covered by HIPAA and expanding breach-notification information requirements. The FTC’s announcement describes the amendments.
A single enforcement action is not a market rate, but it can clarify the stakes. In February 2023, the FTC said more than 55 million consumers had visited or used GoodRx’s website or mobile apps since January 2017 and announced a proposed order that included a $1.5 million civil penalty over alleged sharing of sensitive health information for advertising. The FTC’s GoodRx release should be read as an allegation and proposed-order announcement, not proof of a prevalence rate across health apps.
For a bounded technical signal, a 2025 arXiv preprint audited 272 Android mHealth apps selected from Google Play. It found 49.3% used deprecated SHA-1 and that 42 apps transmitted unencrypted data. The preprint is evidence about that defined sample and method; it does not establish that 49.3% of all healthcare apps are insecure.
If you build or assess a mobile health product, that boundary matters. Security and privacy testing should follow the app’s data flows, device behavior, integrations, and regulatory role—not an unsupported industry-wide defect percentage. For broader testing context, see Quash’s guide to mobile app testing on real devices.
What market and download figures cannot prove
A Health & Fitness app-store category is broader than healthcare apps. It can include fitness, meditation, nutrition, and wellness products that do not handle clinical records or deliver care. Conversely, a portal or regulated clinical app may not map cleanly to a category-level market number.
For that reason, this report does not use a global install total, market-size forecast, or app-store category revenue figure as healthcare-app adoption. A download count does not identify unique people, sustained use, clinical activity, or patient outcomes.
There is also no authoritative current global count of all healthcare apps in the evidence used here. App-store taxonomy cannot resolve that gap because it does not create a stable, shared definition of a healthcare-app population.
What the public record still cannot tell you
The available evidence does not supply a verified global count of healthcare apps, a single global user total, or a cross-industry rate for healthcare-app defects, clinical safety failures, or privacy-control failures.
It also cannot convert hospital capability into patient use. Nor can it convert downloads into active users, clinical transactions, or better outcomes. Those are separate measures that require their own population and method.
No first-party Quash data covers this question. Quash has not published healthcare-app telemetry, recurring healthcare-app bug patterns, customer language, or a completed experiment that could establish a quality or safety rate. The missing denominator is therefore visible rather than filled with an invented statistic.
Methodology and source notes
This report prioritizes primary U.S. government sources for patient access, hospital capability, regulatory scope, and enforcement context. It uses Reach3’s current result as a labelled commercial survey, not as an official adoption census, and uses the Android security audit as a labelled preprint with a defined 272-app sample.
The evidence is U.S.-weighted. HINTS and NHIS are U.S. individual measures; ONC’s hospital data concern U.S. non-federal acute-care hospitals; and Reach3 surveyed U.S. adults. None should be presented as a global healthcare-app statistic.
When you cite a number from this page, preserve four details: the metric, the population, the period, and the evidence type. “57% used an app” becomes useful only when it remains “57% of U.S. people who accessed online records, in 2024, in an HINTS-based access measure.”
Conclusion
Healthcare app statistics are most useful when you resist the urge to turn them into one market number. The data supports a clearer picture: patient-record access and hospital interoperability are widespread in the United States, broad consumer health-app use is high in one 2026 commercial survey, and the regulatory and quality picture depends on the app’s specific function.
For your next slide, memo, or product decision, choose the denominator before you choose the statistic. That decision determines whether the number explains healthcare-app behavior—or merely gives a category blur a percentage sign.
Continue reading
More articles from the Quash editorial desk.