How Much Does It Cost to Build a Mobile App? Statistics & Data 2026

Consumers spent $167 billion on in-app purchases and paid apps in 2025, according to Sensor Tower. Yet the cost of building the apps competing for that spending still ranges from a few thousand dollars to well over half a million.
That competitive backdrop is clearer in the full breakdown of these 2025 mobile app revenue statistics, which helps frame development costs against the market apps are built to serve.
The market context in how much it costs to build a mobile app helps position development costs against the revenue environment apps enter.
For a clearer view of the market forces informing those budget decisions, mobile app development statistics report connects revenue trends with the broader development environment.
For teams weighing those trade-offs, a mobile QA automation approach clarifies how mobile testing decisions can affect the long-term cost profile.
To pair that spending total with the scale of app acquisition, global mobile app download statistics clarify the volume competing for the same market.
The full 2026 IAP revenue and app-store statistics breakdown puts that spending in context with platform splits and catalog scale.
So, how much does it cost to build an app in 2026?
A basic app can cost $5,000–$50,000, while most credible, market-ready mobile products require approximately $50,000–$250,000. Complex, regulated or enterprise apps can exceed $300,000–$500,000.
App complexity | Typical development cost | Typical timeline |
Simple app | $5,000–$50,000 | 2–4 months |
Medium-complexity app | $50,000–$120,000 | 4–9 months |
Complex app | $120,000–$300,000+ | 9–18+ months |
Enterprise or regulated app | $200,000–$500,000+ | 12–24+ months |
The first three ranges come from the latest app-development estimates compiled by Business of Apps. Enterprise estimates vary more widely because security, compliance, integrations and custom infrastructure differ substantially between projects.
These are planning ranges, not fixed prices. Most published app-cost figures come from agencies and industry aggregators rather than audited cross-industry studies. The most reliable answer depends on the app’s features, platforms, team location, development method and post-launch requirements.
Those variables also shape the cost of software bugs statistics, especially when post-launch fixes expand maintenance work.

Key app development cost statistics
Simple apps typically cost $5,000–$50,000.
Medium-complexity apps typically cost $50,000–$120,000.
Complex apps generally start at $120,000 and can exceed $300,000.
A production-ready MVP commonly costs $50,000–$150,000.
US and Canadian agencies commonly charge $100–$250 per hour.
Offshore development rates commonly fall between $20 and $50 per hour.
Testing and QA usually account for 15–25% of the build budget.
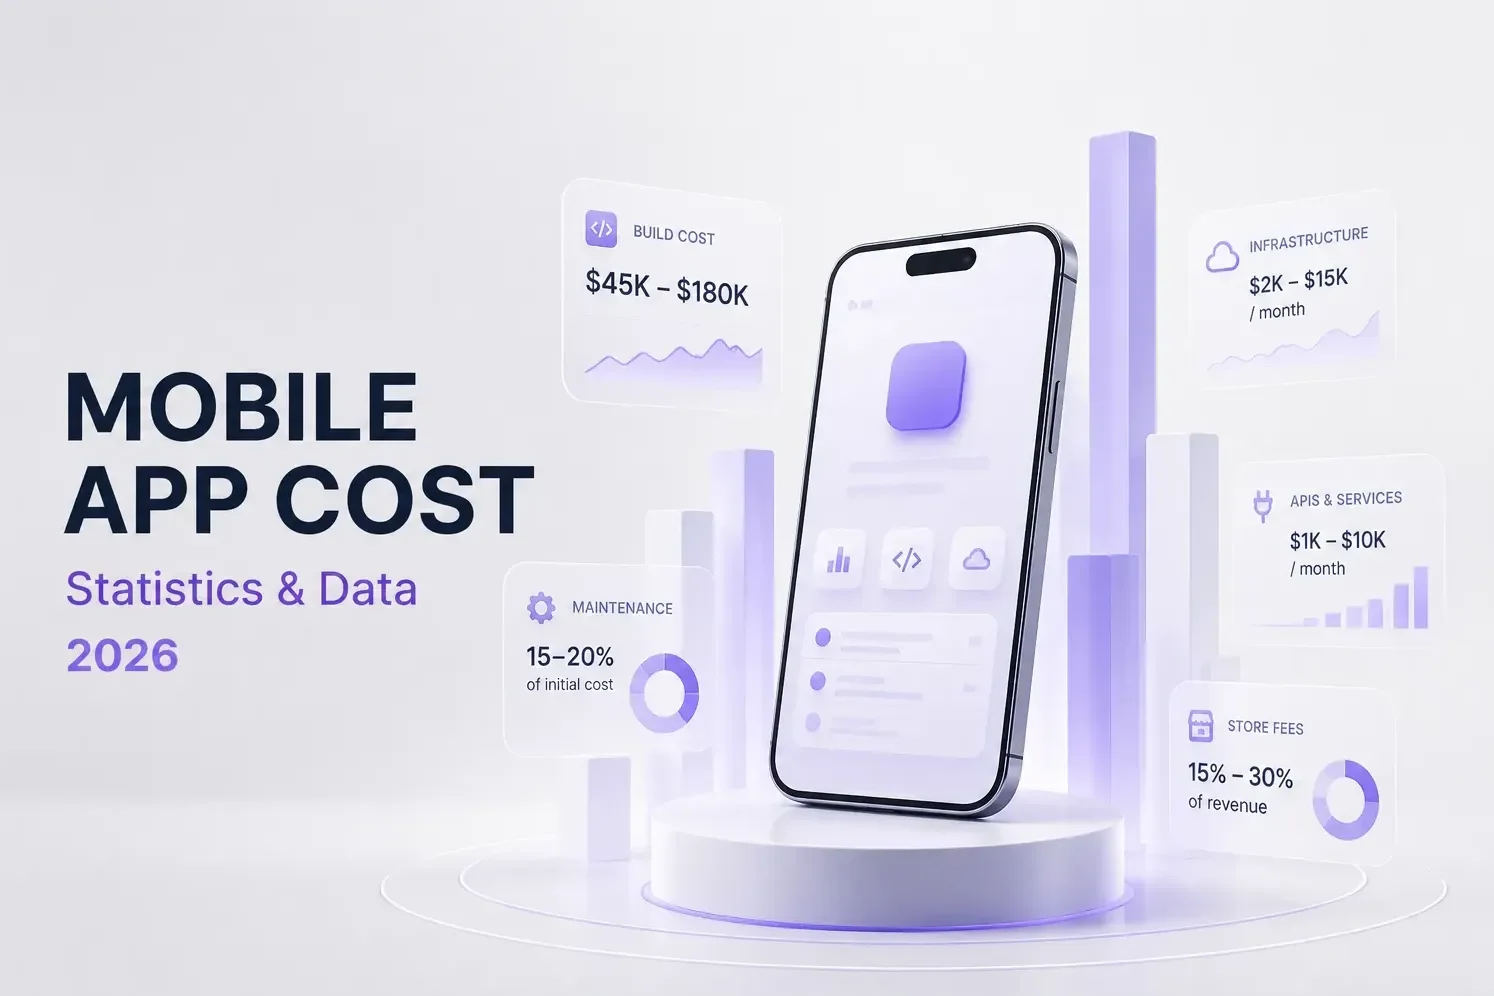
Annual maintenance commonly costs 15–20% of the original development cost.
Individual third-party integrations may add $2,000–$10,000 or more.
Compliance-heavy fintech and healthcare projects can cost 20–30% more than equivalent unregulated products.
Apple charges $99 per year for Developer Program membership, while Google Play charges a $25 one-time registration fee.
The median annual US wage was $133,080 for software developers and $102,610 for software QA analysts and testers in May 2024.
Approximately 46.1% of Android apps were uninstalled within 30 days in AppsFlyer’s 2025 uninstall report.
CISQ estimated that poor software quality cost the United States at least $2.41 trillion in 2022.

Get the Mobile Testing Playbook Used by 800+ QA Teams
Discover 50+ battle-tested strategies to catch critical bugs before production and ship 5-star apps faster.
What is the average app development cost in 2026?
There is no defensible universal average app development cost.
A basic utility, a consumer marketplace and a mobile banking product may all be called “apps,” but they have completely different engineering, security and testing requirements.
The most useful current benchmarks divide projects by complexity:
Simple app: $5,000–$50,000
Medium-complexity app: $50,000–$120,000
Complex app: $120,000–$300,000+
A realistic planning range for a custom, production-ready first version is:
$50,000–$150,000 for a credible MVP and $150,000–$300,000+ for a mature or technically demanding product.
A lower budget is possible, but it usually requires one or more compromises:
A smaller feature set
One supported operating system
Template-based design
Offshore development
Managed backend services
No-code or low-code infrastructure
Reduced device coverage
Limited security and compliance requirements
The outdated $171,450 “average”
One of the most repeated mobile app development cost statistics is that the average app costs $171,450.
Those recurring services fit within enterprise SaaS spend and portfolio benchmarks, which helps place app ownership costs in the context of wider software budgets.
That number originated from older Clutch research, generally traced to around 2015. It is still recycled in current articles, often without its original year or methodology.
It can provide historical context, but it should not be presented as the average cost of developing an app in 2026.
The stronger conclusion is that app costs form a broad range. Small, tightly scoped projects can remain below $50,000, while enterprise platforms can exceed $500,000.
Mobile app development cost by complexity
Simple app: $5,000–$50,000
A simple app normally has limited backend logic and a small number of core workflows.
Common features include:
Email or social login
User profiles
Static or API-delivered content
Forms
Push notifications
Basic analytics
One user role
One supported platform
Managed services such as Firebase
Simple apps are commonly estimated at 300–600 development hours and two to four months of work.
The bottom of the range generally represents prototypes, internal tools or template-driven products. A polished consumer app with custom branding, analytics and proper device testing will usually sit closer to the upper end.
Medium-complexity app: $50,000–$120,000
A medium-complexity app includes more substantial backend logic, integrations and user states.
Typical features include:
Payments
Maps and geolocation
Search and filtering
Multiple user roles
User-generated content
Admin dashboards
Third-party APIs
Offline support
Subscription management
Cross-platform delivery
These apps commonly require 600–1,200 hours and four to nine months of work.
Marketplaces, e-commerce apps, subscription products and SaaS companion apps commonly fall into this category.
Complex app: $120,000–$300,000+
Complex mobile apps involve large amounts of custom engineering, real-time systems or strict operational requirements.
Typical cost drivers include:
Real-time chat
Live location tracking
Video or audio streaming
Recommendation engines
AI features
IoT integrations
Custom backend infrastructure
High transaction volumes
Advanced security
Regulatory compliance
Separate customer, operator and administrator apps
These projects frequently exceed 1,200 hours and may require nine to eighteen months before reaching a stable first release.
Fintech, telemedicine, logistics and large marketplace products often fall into this band.
How individual features affect app development cost
Feature count is usually a better cost predictor than screen count.
A five-screen app with payments, real-time tracking and custom infrastructure may cost more than a 20-screen content app.
The estimates below are agency-published planning figures, not surveyed industry medians. Hours are more transferable than dollar values because the final price depends on the team’s hourly rate.
Feature | Estimated development effort |
Email and password authentication | 40–80 hours |
Firebase authentication, database and push setup | 15–25 hours |
Comparable custom backend infrastructure | 60–100 hours |
Production Stripe integration | 40–60 hours |
Real-time chat or messaging | 150–250 hours |
Custom geolocation and live tracking | 80–150 hours |
Salesforce or HubSpot integration | 50–80 hours |
Template-based UI design | About 60 hours |
Custom design for 10–15 screens | About 160 hours |
Premium motion and micro-interactions | 320+ hours |
Netguru estimates that Firebase authentication, data and notifications can be scaffolded in 15–25 hours, compared with 60–100 hours for comparable custom backend infrastructure. It estimates a production-grade Stripe implementation at approximately 40–60 development hours.
Illustrative integration costs
Integration | Published cost range |
Payment processing | $3,000–$8,000 |
Social login | $1,500–$3,000 |
Maps and geolocation | $2,000–$5,000 |
Analytics | $1,500–$4,000 |
Push notifications | $1,000–$2,500 |
Transactional email | $1,000–$2,000 |
General third-party integration | $2,000–$10,000+ |
These are directional agency figures. Their value is in showing how several apparently minor integrations accumulate, not in treating any single row as a guaranteed quote.
A basic AI chatbot using an existing model API may add roughly $10,000–$25,000. Recommendation engines, predictive systems and proprietary AI infrastructure can add $50,000 or substantially more.
Integrating an existing AI service and developing a specialised AI system are different cost categories.
App development cost by platform
Is iOS or Android cheaper?
For equivalent features, native iOS and Android development costs are generally similar.
The work differs in practice:
Android supports a wider combination of manufacturers, screen sizes and OS versions.
iOS has fewer active hardware combinations but stricter platform conventions.
Available developer talent and hourly rates vary by market.
Some hardware and operating-system APIs require platform-specific work.
Android may require a broader testing matrix because of device fragmentation. That does not justify claims that Android universally costs 20%, 30% or 50% more.
For early budgeting, assume that equivalent native iOS and Android apps cost roughly the same until the technical requirements prove otherwise.
How much does it cost to support both platforms?
Separate native applications require:
Two codebases
Two engineering skill sets
Two build pipelines
Two testing matrices
Two sets of platform-specific fixes
Continued maintenance on both platforms
Building two native apps can therefore approach twice the mobile engineering effort of supporting one platform.
It is not exactly double because backend infrastructure, design, product management and some QA processes can be shared.
Is cross-platform development cheaper?
Flutter and React Native let teams share much of the application code between iOS and Android.
Cross-platform development is commonly estimated to reduce costs by approximately 30–40% compared with building two separate native applications. Netguru similarly states that substantial code reuse can reduce development cost by around 30%.
The saving is usually strongest for products with:
Standard interfaces
Forms and content
API-driven functionality
Common navigation patterns
Limited platform-specific behaviour
The advantage can shrink when the app requires:
Bluetooth or IoT integrations
Advanced background processing
High-performance graphics
AR features
Complex platform-specific UI
Extensive custom native modules
Cross-platform development reduces duplicated engineering. It does not remove the need to test separately on Android and iOS.
Do not confuse framework usage with market share
In the 2024 Stack Overflow Developer Survey, Flutter was used by 9.4% of respondents and React Native by 8.4% in the relevant frameworks category.
A separate Statista series reported Flutter usage at 46% and React Native at 35% among surveyed cross-platform developers in 2023. Those were multi-select survey responses, not mutually exclusive market shares. Adding them together does not prove that the two frameworks control 81% of all mobile development.
For a deeper breakdown, see Quash’s Flutter vs React Native statistics.
App development cost by hiring model
Development agency: $50,000–$250,000+
An agency typically provides designers, mobile developers, backend engineers, QA specialists and project management under one engagement.
Agencies cost more than individual freelancers, but they can reduce coordination and delivery risk.
They are generally most suitable when:
The app is business-critical
The client lacks an internal engineering team
Discovery and design are still required
Multiple technical specialists are needed
Delivery governance matters
Freelancers: $5,000–$60,000+
Freelancers can work well for small, tightly defined projects.
They cost less partly because the client takes responsibility for more of the process, including:
Requirements
Design coordination
Backend work
QA
Release management
Documentation
Maintenance
A lower hourly rate does not necessarily produce a cheaper project if the work later requires substantial rework.
In-house team: $400,000–$600,000+ per year
An in-house team has a high short-term fixed cost but provides continuous ownership.
A basic mobile product team may need:
A product manager
A product designer
Two mobile developers
A backend engineer
A QA engineer
DevOps support
The US Bureau of Labor Statistics reported a median annual wage of $133,080 for software developers in May 2024. That excludes recruitment, benefits, equipment, management and infrastructure.
In-house development is most appropriate when the application is a core product that will evolve continuously.
No-code and low-code
No-code tools can be effective for:
Prototypes
Internal tools
Content apps
Simple forms
Early demand validation
They become less suitable when an app needs:
Complex backend logic
Deep hardware access
High transaction volumes
Strict compliance
Custom performance optimisation
Complete infrastructure ownership
The initial build may be cheaper, but subscription fees, platform limitations and future migration costs must be included in the decision.
Mobile app development rates by region
Location creates one of the largest differences in app development cost.
Region | Typical published hourly rate |
United States and Canada | $100–$250 |
Western Europe | $65–$150+ |
Eastern Europe | $40–$100 |
Latin America | $40–$75 |
India | $20–$50 |
Southeast Asia | $15–$40 |
A 2,000-hour project billed at $25 per hour costs $50,000. The same number of hours billed at $150 per hour costs $300,000.

Hourly rates do not tell the whole story. Lower-cost teams can introduce additional expenses through:
Communication delays
Increased project-management needs
Weak documentation
Quality inconsistencies
Rework
Time-zone separation
Staff turnover
The goal is not to minimise the hourly rate. It is to minimise the total cost of delivering and maintaining a reliable product.
App development cost by category
The phrase “an app like Uber” could describe a prototype, a single-city MVP or a global logistics system.
That is why category estimates differ by hundreds of thousands of dollars.
App category | Typical published cost range |
Ride-hailing or on-demand | $70,000–$300,000+ |
E-commerce or shopping | $50,000–$300,000+ |
Food delivery | $30,000–$100,000+ |
Fintech or banking | $60,000–$400,000+ |
Healthcare or telemedicine | $50,000–$250,000+ |
Social or community | $35,000–$250,000+ |
Fitness or wellness | $55,000–$90,000+ |
SaaS companion app | $40,000–$200,000+ |
Multi-service super-app | $150,000–$300,000+ |
These ranges are compiled primarily from agency estimates. They should be used to compare the relative complexity of app categories, not as fixed quotations.

Why fintech and healthcare apps cost more
Regulated apps require work that ordinary consumer products may not.
Typical requirements include:
Identity verification
Audit trails
Data encryption
Role-based access
Fraud detection
Secure storage
Penetration testing
Compliance documentation
Banking or payment integrations
Healthcare-record integrations
Published estimates commonly place the compliance premium at approximately 20–30% of development cost.
Healthcare integrations involving EHR or FHIR systems may independently add tens of thousands of dollars depending on the provider, data model and access requirements.
Mobile app development cost breakdown by phase
A mobile app budget covers more than writing code.
Development phase | Typical share of budget |
Discovery and planning | 10–15% |
UI and UX design | 20–25% |
Engineering | 40–55% |
Testing and QA | 15–25% |
Deployment | 5–10% |
These are independent published ranges. Their upper limits should not be added together because companies classify project management, backend development, QA and deployment differently.

Discovery and planning
Discovery defines:
Product requirements
Target users
Feature priorities
Technical feasibility
Architecture
Delivery scope
Timeline
Skipping discovery may make an initial quote appear cheaper while increasing the risk of expensive scope changes later.
UI and UX design
Design cost depends on whether the product uses:
Existing components
A standard design system
Custom branding
Illustrations
Motion
Accessibility requirements
Platform-specific interfaces
A template-driven interface may require around 60 design hours. A custom system covering 10–15 screens may require about 160 hours. Premium interactions can push design effort above 320 hours.
Engineering
Engineering is usually the largest cost category and includes:
Mobile application code
Backend services
APIs
Databases
Authentication
Integrations
Infrastructure
Admin systems
Security
Analytics
For technically complex apps, backend systems can consume as much effort as the visible mobile interface.
How much does mobile app testing cost?
In finance, security testing overhead for financial apps can raise QA demands beyond baseline estimates.
Testing and QA typically account for 15–25% of the app development budget. Regulated, safety-critical and transaction-heavy applications may allocate approximately 30–40%.
QA benchmark | Typical cost |
Standard app QA allocation | 15–25% of build budget |
Regulated or safety-critical app | 30–40% of build budget |
Offshore outsourced QA | $18–$40 per hour |
Nearshore outsourced QA | $35–$60 per hour |
Onshore outsourced QA | $70–$120 per hour |
US in-house QA analyst median salary | $102,610 per year |
The outsourced rates are vendor-published 2026 benchmarks and vary by seniority, specialisation and engagement type. GigaTester places offshore QA at $18–$40 per hour, nearshore QA at $35–$60, and onshore QA at $70–$120.
The BLS salary figure is the national median for software quality assurance analysts and testers in May 2024.
For a $100,000 app, a typical testing allocation would be approximately $15,000–$25,000. For a $300,000 regulated platform, QA spending can exceed $60,000.

What mobile app QA includes
A production app may require:
Functional testing
Regression testing
Device compatibility testing
OS-version testing
Network-condition testing
Accessibility testing
Performance testing
Security testing
API testing
Payment-flow testing
Database validation
Release verification
Mobile QA is especially sensitive to device fragmentation, operating-system behaviour, permissions, keyboards, network conditions and manufacturer-specific Android changes.
Manual testing versus automation cost
Manual testing generally has lower setup cost but a recurring cost every time the same flow is tested.
Automation has a higher initial cost, followed by a lower marginal cost per execution—but only while the automated tests remain reliable.
Approach | Initial cost | Recurring execution cost | Main limitation |
Manual testing | Lower | Higher | Repetitive work scales with every release |
Scripted automation | Higher | Lower per run | Scripts require maintenance when the product changes |
AI-assisted automation | Medium to high | Potentially lower | Reliability and review requirements vary by tool |
Manual testing remains valuable for exploration, usability and new workflows. Automation is better suited to repetitive regression flows such as login, checkout, search and account creation.
Traditional automation can become expensive when scripts repeatedly break after UI changes. Mobile-first platforms such as Quash aim to reduce that maintenance burden by allowing teams to define and execute tests through plain-language workflows rather than maintaining every flow as a brittle script.
The objective is not to remove human QA. It is to stop skilled testers from spending most of their time repeating predictable flows across devices and releases.
The cost of releasing poor-quality software
CISQ estimated that poor software quality cost the United States at least $2.41 trillion in 2022, while accumulated software technical debt reached approximately $1.52 trillion.
A 2017 QualiTest and Google Consumer Surveys study of more than 1,000 US users found that 88% would abandon an app because of bugs or glitches. The figure is dated and should be treated as historical consumer-survey evidence rather than a new 2026 result.
A newer Luciq survey of more than 1,000 US mobile users, published in February 2026, reported that:
More than half would abandon an app after two or three crashes.
53.2% had abandoned a purchase during a major sale because of a crash or slowdown.
77.5% said repeated performance issues damaged their perception of a brand.
AppsFlyer’s 2025 uninstall report found that 46.1% of Android apps were uninstalled within 30 days in 2024, compared with 46.9% the previous year. AppsFlyer notes that uninstalls have many causes, so this should not be interpreted as a bug-only statistic.
The hidden cost: first-year ownership
The initial build is not the total cost of owning an app.
After launch, teams continue paying for:
Maintenance
Cloud infrastructure
Monitoring
Third-party APIs
Security
App-store accounts
Payment processing
Customer support
Testing
OS compatibility updates
New features
Annual maintenance commonly costs 15–20% of the original development budget. Netguru and Zoho publish broader ongoing-cost ranges extending to approximately 25% depending on the app.
For a $100,000 app, that means budgeting at least $15,000–$20,000 per year before major new features.
One agency analysis found that initial development represented around 55% of the first-year investment across its projects. That is not an industry-wide average, but it illustrates how much spending can occur after launch.
Typical ongoing mobile app costs
Cost category | Typical benchmark |
Annual maintenance | 15–20% of initial build |
Small-scale cloud infrastructure | $20–$500 per month |
Growing or high-traffic infrastructure | $200–$5,000+ per month |
Third-party API stack at scale | $500–$3,000 per month |
Security audits | $1,000–$10,000 per year |
Penetration testing | $5,000–$15,000 |
Apple Developer Program | $99 per year |
Google Play registration | $25 one time |

A practical first-year cost model is:
First-year cost = initial development + annual maintenance + infrastructure + third-party services + security + distribution costs.
Some industry guides estimate lifetime ownership at three to five times the initial build. That multiplier is widely repeated but cannot be traced to one definitive industry study. It is better treated as a warning about long-term ownership than as a universal benchmark.
App-store fees and commissions in 2026
The cost to build a mobile app provides context for the economics behind expanding educational app catalogs.
Store registration is inexpensive compared with development, but commissions can become a major operating cost for apps selling digital goods and subscriptions.
Store | Developer account fee | Standard digital-goods fee |
Apple App Store | $99 per year | 30% standard; 15% for qualifying programmes and subscriptions |
Google Play | $25 one time | 15% on the first $1M for enrolled developers; 30% above; 15% for subscriptions |
Apple’s official Developer Program documentation lists the annual membership fee at $99. Its published commission is generally 30%, reduced to 15% for developers in programmes such as the App Store Small Business Program and for qualifying subscriptions.
Google Play charges a $25 one-time registration fee. Its published service-fee tier charges 15% on the first $1 million in annual revenue and 30% above that, while automatically renewing subscriptions are charged 15%.
Alternative-billing programmes, regional regulations and special store programmes can change these rates. Teams should verify the current Apple and Google terms for each target market rather than hard-coding a single global commission into a long-term forecast.
Mobile app development cost calculator
Mobile app development cost calculator
A planning estimate — an honest range, not a fixed quote. Adjust the inputs to fit your project.
Estimated initial build
$22,000 – $119,000
Show breakdownHide breakdown
First-year operating (not included in the build above)
These figures are a rough planning estimate to help you budget — not a quote. Actual costs depend on final scope, team, and vendor.
How to reduce mobile app development cost without damaging quality
Start with one valuable workflow
An MVP should validate the product’s core behaviour, not reproduce the entire long-term roadmap.
Defer:
Secondary user roles
Advanced personalisation
Complex admin tools
Non-essential integrations
Premium visual effects
Rare edge-case automation
Do not compromise the reliability of the primary user journey.
Use managed infrastructure before building everything yourself
Managed authentication, databases, notifications and analytics can reduce early backend effort.
Custom infrastructure is justified when the product has unusual security, ownership, scale or performance requirements—not merely because custom code sounds more sophisticated.
Launch on one platform when the audience allows it
Starting with either iOS or Android can reduce the initial engineering and testing scope.
This only works when user research shows that the target audience is concentrated on one platform.
Use cross-platform development selectively
Flutter and React Native can reduce duplicated work for standard app interfaces.
Do not select them solely because an agency promises a fixed percentage saving. Assess hardware access, performance, native integrations and platform-specific UI first.
Include QA in the first estimate
Testing should not appear as an optional cost near the end of development.
Define device coverage, acceptance criteria and critical regression flows before implementation begins.
Budget for ownership, not only launch
A budget that excludes maintenance, infrastructure, monitoring, support and continued testing is incomplete.
Model at least the first twelve months before approving development.
Methodology and limitations
This article compiles the latest available app development cost benchmarks, updated for 2026.
The evidence includes:
Industry aggregators
Agency project estimates
Developer surveys
US government wage data
Software-quality research
Mobile analytics reports
Consumer surveys
Official Apple and Google fee documentation
Most mobile app development cost figures are estimates published by service providers, not audited market-wide averages.
When comparing estimates, mobile app development costs also show why provider-published figures should not be treated as market-wide evidence.
Agency estimates may differ because of:
Region
Client size
Project scope
Team seniority
Included services
Pricing model
Commercial incentives
For that reason, this article uses ranges, identifies source limitations and avoids presenting one universal “average” as fact.
Frequently asked questions
How much does it cost to build an app from scratch?
A basic app can cost $5,000–$50,000. A custom, market-ready mobile product generally costs $50,000–$250,000, while complex or regulated apps may exceed $300,000–$500,000.
What is the average mobile app development cost?
There is no reliable universal average. A practical planning range for a production MVP is approximately $50,000–$150,000, depending on features, platform coverage, team location and backend complexity.
Can you build an app for $10,000?
Yes, but the scope will usually be limited. A sub-$10,000 app will commonly depend on templates, no-code tools, offshore freelancers or a very small feature set. It is unlikely to include substantial custom infrastructure, integrations and device testing.
How much does it cost to build an MVP?
A basic MVP may cost $20,000–$50,000. A production-ready MVP with custom design, backend systems, analytics and integrations more commonly costs $50,000–$150,000.
Is it cheaper to build for iOS or Android?
For equivalent scope, native iOS and Android development costs are generally similar. Android may require broader device testing, while iOS costs depend on platform-specific requirements and available talent.
Is Flutter or React Native cheaper than native development?
Cross-platform frameworks can reduce duplicated work and are commonly estimated to save approximately 30–40% compared with two separate native apps. The saving can shrink when an app requires extensive native functionality or platform-specific UI.
How much does mobile app maintenance cost?
Annual maintenance typically costs 15–20% of the original development budget. A $100,000 app may therefore require approximately $15,000–$20,000 per year before major feature development.
How much should be budgeted for app testing?
Testing and QA usually account for 15–25% of the development budget. Regulated, safety-critical or transaction-heavy apps may require 30–40%.
How long does it take to build a mobile app?
A simple app may take two to four months. Medium-complexity products commonly take four to nine months, while complex applications may require nine to eighteen months or longer.
Final takeaway
There is no single answer to how much it costs to build an app.
A practical 2026 planning range is:
$5,000–$50,000 for a basic app
$50,000–$120,000 for a medium-complexity app
$120,000–$300,000+ for a complex app
$200,000–$500,000+ for a regulated or enterprise platform
The cheapest initial build is not necessarily the lowest-cost product.
Architecture, testing, maintainability, infrastructure and continued ownership determine whether an app remains affordable after launch.
Sources and references
Continue reading
More articles from the Quash editorial desk.