Mobile App Revenue Statistics 2026: $167B in Spend and the Monetization Shifts Behind It

More downloads and more time in your app do not automatically mean more revenue. In 2025, mobile’s most consequential monetization shift was not the headline growth rate: non-game apps generated more in-app purchase revenue than games for the first time, while generative AI created a meaningful new paid-app category.
The short answer: Sensor Tower reports $167 billion in global mobile in-app purchase (IAP) revenue across iOS and Google Play in 2025, up 10.6% year over year. These mobile app revenue statistics point to a mature market where subscriptions, higher-value transactions, and retention matter more than simply adding installs.
Global mobile app revenue reached $167 billion in 2025
Global IAP revenue reached $167 billion in 2025, an increase of 10.6% year over year, according to Sensor Tower’s . This figure measures consumer purchases within apps across Apple’s App Store and Google Play; it is not a measure of mobile advertising spend.
Business of Apps estimates combined app-and-game consumer spending at $166.8 billion in 2025, compared with $150.1 billion in 2024. The two published estimates are close, but they should not be treated as interchangeable measurements because data providers can apply different definitions and reporting methods.
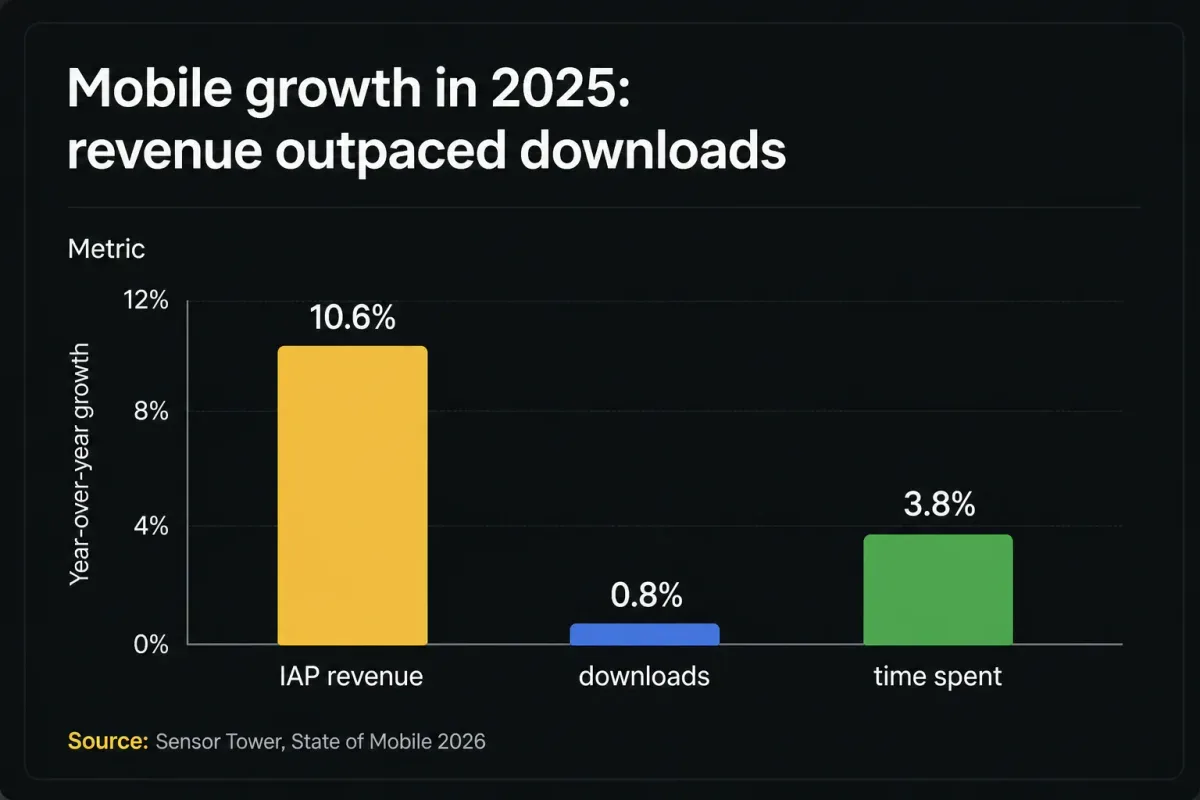
The growth story is more revealing than the total alone. Sensor Tower reports that downloads rose only 0.8% to about 150 billion in 2025, while IAP revenue grew 10.6%. Your biggest opportunity may therefore sit in what happens after acquisition: whether a user reaches value, converts, and returns.

Get the Mobile Testing Playbook Used by 800+ QA Teams
Discover 50+ battle-tested strategies to catch critical bugs before production and ship 5-star apps faster.
Non-game apps overtook games for the first time
Non-game apps generated more IAP revenue than games in 2025 for the first time, according to Sensor Tower’s State of Mobile announcement. Non-game IAP revenue grew 21% year over year and was nearly three times its level five years earlier, while game IAP revenue grew 1.3% to nearly $82 billion.
Business of Apps puts 2025 consumer spending at $83.6 billion for apps and $83.2 billion for games in its app-revenue data. Its separate global market overview publishes a slightly different split, so the precise dollar allocation varies by page; the direction does not. Apps passed games.
Games remain a large and growing business. The change is that more non-game products now turn recurring utility, content, entertainment, communication, and creation into paid transactions. That makes monetization design a product question, not merely a pricing-screen question.
Subscriptions help explain the revenue shift
Business of Apps, citing its App Data Report, puts subscription revenue at $79.5 billion in 2025 and attributes 73% of that revenue to iOS in its app-revenue data. The figure helps explain why services outside gaming have gained ground: a subscription can turn repeat value into recurring billing.
For your app, subscription performance depends on more than the price shown at the paywall. A user needs to reach the value moment, begin a trial or purchase, keep access across devices and sessions, and find enough continuing value to renew.
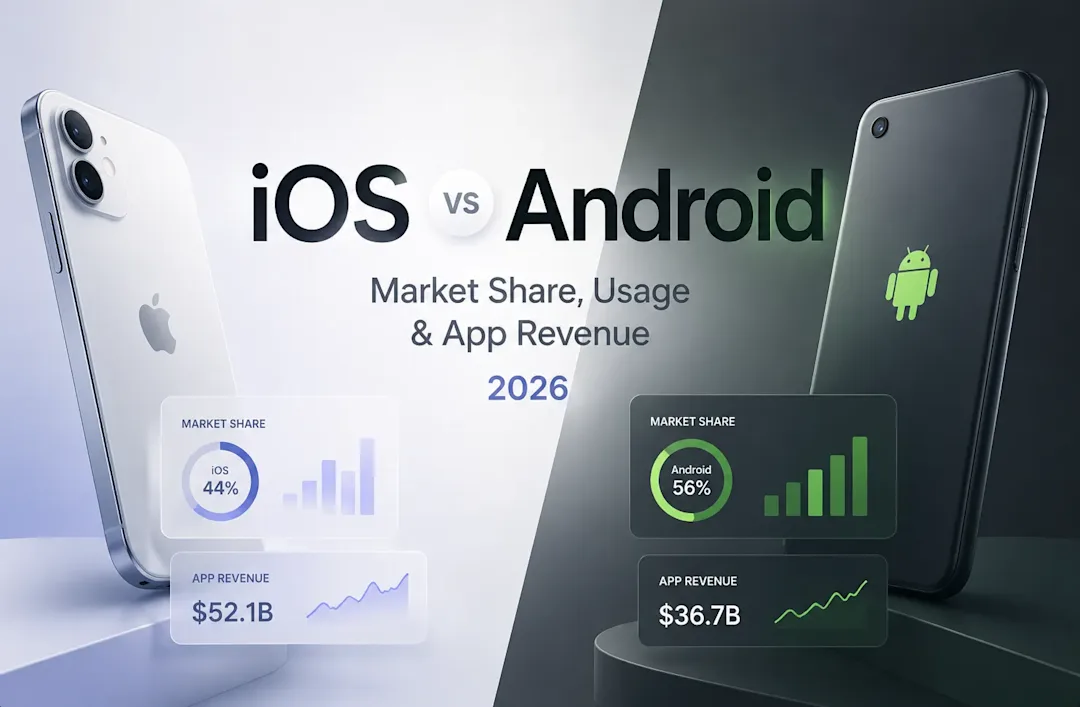
Platform mix still matters. If you need the platform-level context behind consumer spend, see Quash’s analysis of iOS and Android market share and app revenue. The important planning point is that a large install base and a high-spending audience are not necessarily the same audience.
Mobile advertising remains the larger revenue pool
Global mobile advertising spend reached $419 billion in 2025, up 7.4% year over year, according to Business of Apps. At that scale, mobile ad spend was roughly 2.5 times the $167 billion IAP total reported by Sensor Tower.
These pools measure different economic activity. IAP revenue is what consumers pay within apps; ad spend is what advertisers pay to reach mobile audiences. An app cannot swap one for the other without changing its product experience, measurement model, and incentives.
For an ad-supported app, a session has to remain reliable long enough for an impression to load and be viewed. For a purchase-led app, the same reliability question applies to checkout and entitlement. Your monetization model determines which journey deserves the most testing attention.
Generative AI became a $5 billion app category
Within the wider mobile economy, Generative AI became a $5 billion app category helps position AI monetization alongside broader app-spending patterns.
Generative AI apps became a material revenue category in 2025. Sensor Tower reports that generative AI app downloads doubled to 3.8 billion, while IAP revenue nearly tripled to more than $5 billion in its 2026 market report.
People spent 48 billion hours in generative AI apps in 2025—about 3.6 times the 2024 total and nearly 10 times the 2023 total, according to Sensor Tower. The category is no longer only a technology trend; it is now part of the mobile revenue mix.
Sensor Tower also lists ChatGPT as the third-highest-grossing app of 2025, behind TikTok and Google One. That position connects attention and willingness to pay, but it does not guarantee that every AI app will retain users or support the same pricing model.
If your product includes AI features, test the full value path rather than only the model response. Network changes, sign-in, payment status, generation failures, long waits, and interrupted sessions can all determine whether the feature feels worth paying for. Quash’s guide to AI-powered mobile app testing outlines testing approaches that help you cover those conditions.
Revenue rose faster than downloads
Consumers spent 5.3 trillion hours in apps in 2025, up 3.8% year over year, according to Sensor Tower. That is about 3.6 hours per day per mobile user. Downloads grew 0.8% in the same period, while IAP revenue grew 10.6%.
The figures suggest that mobile growth is shifting toward extracting more value from existing demand. In practical terms, you can read this as a lifetime-value (LTV) story: the revenue associated with a user over the duration of their relationship with your app matters more when new acquisition is growing slowly.
In mobile QA, Quash repeatedly sees the same revenue-path risks: a crash before a subscription paywall, a frozen rewarded-ad flow, or a slow screen at checkout. These are qualitative bug patterns, not a claim that every defect has the same commercial impact. The priority is to identify which failures occur closest to the moment your user receives or pays for value.
That is why your retention and quality metrics should be read together. Use mobile app retention benchmarks, churn, and uninstall data to frame the retention side, then investigate whether specific release, device, network, or flow failures are affecting the cohorts that matter most.
The categories and markets behind the growth
Sensor Tower identifies Social Media, Streaming Movies and TV Shows, and Dating as the largest non-game sources of IAP revenue in 2025. Social apps accounted for nearly 2.5 trillion hours of time spent, according to its official 2026 press release.
The fastest-growing download categories were not identical to the largest revenue categories:
Short-form drama app downloads grew 278% year over year.
Generative AI app downloads grew 148% year over year.
Sports-betting app downloads grew 24% year over year, alongside expansion into markets including Brazil.
Sensor Tower also reports declining global retail-app downloads and time spent as expansion from Temu and SHEIN slowed. A category can grow quickly in installs without yet delivering the revenue scale of a mature subscription, social, streaming, or dating product.
The United States remained the largest mobile market by revenue, with consumers spending nearly $60 billion in 2025, according to Sensor Tower. Your geographic strategy should therefore account for the difference between where users download and where they spend.
How 2025 compared with earlier forecasts
The “2026” in this article refers to the vintage of Sensor Tower’s report, which covers full-year 2025 results. It is not a forecast that 2026 IAP revenue will reach a particular total.
In June 2022, Sensor Tower projected that global consumer spending on premium apps, IAPs, and subscriptions would reach $233 billion by 2026, at a 12% compound annual growth rate from $132 billion in 2021. Applying that published growth path produces an implied 2025 total of roughly $208 billion, about 25% above the $167 billion reported for 2025.
In July 2023, Sensor Tower forecast $186 billion in worldwide mobile app revenue by 2027 at an 8.4% CAGR. Applying that published trajectory produces an implied 2025 figure of about $158 billion, slightly below the 2025 result.
The comparison is a reminder to treat long-range market forecasts as scenarios rather than fixed outcomes. The 2022 outlook was more optimistic than the eventual 2025 result, while the 2023 outlook was more conservative.
For an arithmetic illustration rather than a forecast, maintaining 2025’s 10.6% growth rate would take $167 billion to roughly $185 billion in 2026. Actual results will depend on consumer demand, pricing, category shifts, regulation, and the rate at which new services convert attention into paid use.
What the numbers mean for your mobile app
The data points to four practical decisions.
Measure monetization by cohort, not just installs. Track trial starts, conversion, renewal, churn, and revenue per active user. These measures show whether you are creating more value from an existing audience or merely adding acquisition volume.
Treat a subscription as an end-to-end experience. Paywalls, billing, entitlement restoration, cancellation, and offline states all shape whether the customer receives the value they purchased.
Test revenue paths on real devices. Validate login, purchase, paywall, ad, and AI-generation flows across device models, operating-system versions, networks, interruptions, and low-resource conditions. Quash’s real-device mobile testing guide can help you build that coverage.
Connect quality signals to business events. A crash, freeze, or slow response means something different during onboarding than it does during renewal or checkout. Record the point in the journey where it happens so you can prioritize the defects nearest to revenue and retention.
You do not need to chase every fast-growing category. You need to make the moment that creates value for your user reliable, measurable, and easy to repeat.
Sources and definitions
This report uses 2025 full-year data from Sensor Tower’s and its official press release. Business of Apps’ App Revenue Data provides the subscription, platform, advertising, and corroborating consumer-spend figures cited above.
“IAP revenue” refers to consumer payments within apps. “Mobile ad spend” refers to advertiser spending to reach mobile audiences. They are useful measures of market scale, but they describe different revenue pools.
The forecast comparison uses Sensor Tower’s published 2022 and 2023 forecasts alongside the reported 2025 actual. The implied 2025 values and the $185 billion 2026 illustration are arithmetic calculations from the published inputs, not new market forecasts.
Conclusion
The $167 billion headline matters, but the combination matters more: 10.6% IAP revenue growth, 0.8% download growth, non-game apps passing games, $79.5 billion in reported subscription revenue, and more than $5 billion in generative AI IAP revenue.
Mobile is becoming more dependent on the value you create after install. For your next release, focus on the journeys that drive conversion and repeat use, then test those journeys with the same rigor you apply to acquisition.
Continue reading
More articles from the Quash editorial desk.