Mobile Gaming Statistics: Industry and Testing Data for 2026


A mobile game can reach thousands of downloads while your team is still deciding which devices, stores, and live-event flows deserve regression coverage before the next update. That is why market size alone is not enough: it tells you how large mobile gaming is, not how reliably games ship.
The short answer is that the strongest mobile gaming statistics available in 2026 describe 2025 outcomes. They show substantial spending, downloads, and a widening difference between platform volume and monetization. They do not provide a representative benchmark for mobile-game test coverage, device-matrix coverage, or release-blocking defects. This report separates those market observations from game-QA survey results and adjacent mobile-quality evidence so you can cite each number for what it actually measures.
Key mobile gaming statistics for 2026
$82 billion: Sensor Tower measured $82 billion in mobile-game in-app purchase (IAP) revenue in calendar 2025, up 1% year over year. This is store-linked IAP revenue, not a total that includes every advertising, direct-to-consumer, or off-store revenue stream. Sensor Tower’s 2026 State of Gaming release
$113.3 billion: PC Gamer reported that Newzoo put 2025 global mobile-game revenue at $113.3 billion within a broader $201.6 billion games market. This is journalism reporting Newzoo research, not a directly observed Newzoo publication, and its broader revenue scope differs from Sensor Tower’s IAP measure. PC Gamer’s report on Newzoo’s 2025 estimate
52 billion: Sensor Tower counted 52 billion game downloads across mobile, PC, and console in 2025. It is a cross-platform total, not a mobile-only download total.
95,000 per minute: Sensor Tower separately reported 95,000 mobile-game downloads per minute in 2025. The source supplies a rate, so this report does not convert it into an implied annual total.
42 billion: Google Play accounted for 42 billion game downloads in 2025 in Sensor Tower’s cross-platform dataset. In the same analysis, the App Store generated 75% higher gaming IAP revenue than Google Play. Sensor Tower’s State of Gaming report
25 billion installs: AppsFlyer’s 2026 gaming-marketing analysis covered 25 billion installs across more than 9,600 games as studios navigated 2025. It is a gaming-marketing dataset, not a QA benchmark or a total-market revenue measure. AppsFlyer’s State of Gaming for Marketers
77%: In a survey of more than 300 US game developers published in February 2025, 77% said they had conducted less QA than they should have for their latest release. This is self-reported practice, not mobile-game defect telemetry. modl.ai’s State of Games QA survey
99.95%: Luciq reported a 99.95% median crash-free session rate among apps using Instabug’s platform in 2024. It is a mobile-app stability benchmark, not a mobile-game benchmark. Luciq’s Mobile App Stability Outlook 2025

Get the Mobile Testing Playbook Used by 800+ QA Teams
Discover 50+ battle-tested strategies to catch critical bugs before production and ship 5-star apps faster.
How should you read mobile-game revenue figures?
The $82 billion and $113.3 billion figures should not be added together or treated as competing counts of the same thing.
Sensor Tower’s figure is explicitly mobile-game IAP revenue: spending linked to in-app purchases in its measurement. The Newzoo figure reported by PC Gamer is broader mobile-game revenue. Different channel coverage and methodologies can produce different totals without either figure being automatically wrong.
For a deck or planning document, label the metric rather than writing simply “mobile gaming revenue.” Use mobile-game IAP revenue when citing Sensor Tower and broader mobile-game revenue, reported by Newzoo via PC Gamer when citing the $113.3 billion estimate. That wording preserves the source and scope a reader needs to interpret the number.
It also prevents an older error from returning: Newzoo’s roughly $103 billion figure was a 2025 forecast, not an observed 2025 result. A forecast can be useful for planning, but it should never sit beside completed-year results as though both describe the same period.
What do downloads and platform data show?
Mobile gaming remains a high-volume distribution channel, but volume and monetization do not line up neatly by platform. Google Play represented 42 billion downloads in Sensor Tower’s 2025 dataset, while the App Store generated 75% more gaming IAP revenue than Google Play in that analysis.
That contrast does not prove that iOS players spend more in every country, genre, or game. It does show why a single “mobile” total can obscure the choices facing your team. A launch plan, a device test plan, and a monetization test plan may need different platform priorities.
Sensor Tower also interpreted resilient IAP revenue alongside slower download growth as evidence that publishers are putting more emphasis on retaining, engaging, and monetizing existing players through live operations, events, and IP collaborations. That is Sensor Tower’s market interpretation, not evidence that any particular QA practice causes revenue growth.
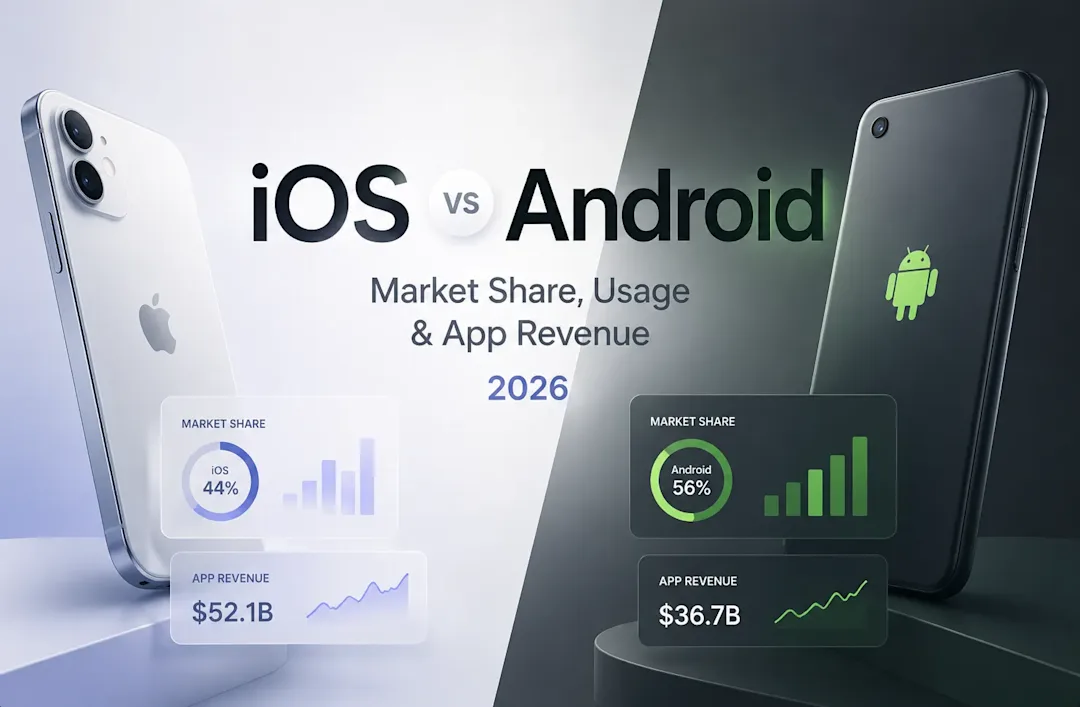
For reader context on wider platform differences, see Quash’s iOS and Android market-share and app-revenue statistics. The mobile-game figures above remain the appropriate sources for game downloads and gaming IAP revenue.
What do game-QA statistics tell you?
The public record has far less mobile-game-specific QA data than it has market data. The most direct game-QA source here is modl.ai’s February 2025 survey of more than 300 US game developers. Its results describe what respondents reported and expected; they do not measure defects in a representative sample of mobile games.
Within that population, 77% said they performed less QA than they should have for their most recent release, and 50% said QA budgets were not growing fast enough to match game complexity. Those responses describe perceived capacity pressure among surveyed US game developers.
Automation was already widespread in the survey: 94% of respondents said their studios used some form of non-AI automation, such as test scripts or automated bug reporting. Expectations for AI were also high: 94% said AI would play an important role in the future of game QA, 88% believed it was as good as or better than traditional methods at finding bugs, and 86% expected it to speed testing and iteration cycles.
Read those AI figures as expectations and opinions, not controlled performance results. The same survey found 87% of respondents considered their studios at least somewhat ready to implement AI in QA, while only 18% considered themselves fully prepared. Interest and operational readiness are different measures.
If you need a broader view of automation trends beyond games, Quash’s 2026 QA automation report covers that adjacent topic. It should not be substituted for game-specific evidence.
What adjacent mobile-quality data can you use?
Adjacent mobile-app datasets help frame risk, provided you do not relabel them as mobile-game statistics.
Stability benchmarks are app-wide, not game-specific
Luciq analyzed 2024 stability data from apps using Instabug’s platform and reported a 99.95% median crash-free session rate. Its platform medians were 99.91% for iOS and 99.80% for Android. These are crash-free-session benchmarks for the participating mobile-app population; they are neither a test-coverage percentage nor a benchmark for mobile games.
Real-device defects can be platform-specific
Mobot’s 2026 Annual Defect Report analyzed 6,372 unique defects from 83 customer apps in 11 industries, based on more than 145,000 automated test executions and 5.8 million QA actions between July 1, 2025 and June 30, 2026. This is a vendor customer-app sample, not a representative mobile-app market survey and not a games-only study. Mobot’s Annual Defect Report release
In that sample, 83% of defects appeared on only one tested platform. Mobot also found that crashes and freezes accounted for 46% of 512 P0 defects, and 85% of those P0 defects appeared on only one tested platform. The defensible takeaway is narrow: paired platform testing can reveal platform-specific failures in this customer-app sample. The result does not establish a mobile-game defect rate.
App reviews show what users describe as broken
unitQ analyzed 67.7 million publicly available Apple App Store and Google Play reviews posted from January through December 2025, across 8,000 apps in 10 verticals including gaming. It found complaints about broken product experiences outnumbered feature requests by six to one. This is review evidence about reported user experience, not a lab-measured defect rate. unitQ’s app-review analysis
A unitQ release distributed through PR Newswire also reported that 80–85% of stability and installation complaints in the analysis came from Android. That percentage applies to the analyzed review dataset, not to mobile games alone. unitQ’s PR Newswire release
Which mobile-game testing statistics are still missing?
No verified public dataset reviewed for this report supplies a representative, mobile-game-only benchmark for:
test-coverage percentage;
device and OS matrix coverage;
regression-test volume;
release-blocking defect rate;
crash rate; or
post-release quality outcomes linked to a defined test program.
That absence matters. Market data can show how much players spend or download, while an app-review dataset can show which complaints users leave. Neither tells you what proportion of a mobile-game regression suite runs across a defined device matrix, or whether that program changes release outcomes.
A useful benchmark would need a clearly sampled population of mobile games, defined device and OS coverage, a stated observation period, and comparable outcomes such as crashes, freezes, payment failures, event failures, hotfixes, or rollback rates. It would also need to separate findings from emulator, simulator, and physical-device runs. Until a dataset does that, precise claims about “average mobile-game QA coverage” are not supportable.
No first-party Quash data covers this question. That leaves a genuine public evidence gap rather than a number that can responsibly be estimated.
What should you do with these statistics?
Use the market figures to frame opportunity and the quality figures to frame uncertainty. The evidence supports a practical planning question: where could a platform-specific failure damage a live event, purchase flow, install, session, or update experience?
Start by separating your own measurements the way these sources separate theirs. Track revenue and downloads independently from crash-free sessions, test coverage, platform coverage, escaped defects, and player feedback. A team that combines them into one “quality” metric cannot see whether a release problem is concentrated on a platform, a device class, or a particular live-ops flow.
Then prioritize tests around the moments your players cannot easily retry: authentication, installation and update paths, payments, rewarded ads, event entry, state recovery, and the core loop after a patch. The public evidence does not prove which one of those tests will improve revenue. It does show that platform-specific defects and complaints about broken basics are material risks worth measuring directly in your own game.
Methodology and definitions
This report prioritizes 2025 market observations published or summarized in 2026. It distinguishes first-party platform measurement from named secondary reporting: Sensor Tower supplies the IAP, download, and platform observations; PC Gamer reports Newzoo’s broader revenue figure; and AppsFlyer supplies a gaming-marketing install analysis.
The testing section uses three different evidence types: a survey of more than 300 US game developers, a mobile-app stability benchmark from apps using Instabug, and vendor or review datasets that include apps beyond games. They are useful because their populations and periods are stated. They are not interchangeable, and none becomes mobile-game-only evidence by being discussed beside market data.
Conclusion
Mobile gaming statistics show a market where distribution remains vast, monetization is durable, and platform patterns matter. The more consequential finding for release planning is what the public record cannot yet answer: there is no representative benchmark connecting mobile-game test programs to quality outcomes at scale.
Use the available numbers for the decision they support, then fill the QA gap with your own release and player-impact measurements. Your next decision should be which platform, flow, and update risk you need to measure before you ship.
Continue reading
More articles from the Quash editorial desk.