Mobile App Market Size in 2026: What the Numbers Actually Measure


A market-size slide can go wrong before you add the first chart. You find a 2026 figure for app revenue, another for app-store spending, and a much larger number for commerce facilitated by apps. They are all real measurements—but they answer different questions.
The short answer: the mobile app market size does not have a single audited global total for 2026. Statista projects US$739.61 billion in worldwide app-market revenue for 2026 under a broad, modeled definition. Other research firms forecast US$391.30 billion and US$322.6 billion because their models define the market differently. Use the number only after you state its denominator.
Key mobile app market statistics for 2026
US$739.61 billion: Statista projects worldwide app-market revenue in 2026 at this level. Its modeled B2C market includes in-app purchases (IAP), paid app purchases, and advertising, along with developer and store commission revenue. This is a forecast, not an audited platform disclosure. Statista
US$475.84 billion, US$6.90 billion, and US$256.87 billion: In the same 2026 Statista model, IAP, paid apps, and advertising respectively make up those revenue streams. They are components of one model, not figures to add to another publisher’s total.
US$391.30 billion: Mordor Intelligence forecasts this 2026 mobile-application-market figure using its proprietary estimation framework, with US$864.5 billion forecast for 2031. It is a commercial modeled estimate, not an observed spending total. Mordor Intelligence
US$322.6 billion: Grand View Research estimates this mobile-application-market figure for 2026, following US$285.7 billion for 2025. Its forecast reaches US$885.3 billion in 2033 under its own market definition. Grand View Research
US$167 billion: Sensor Tower reports global IAP revenue across iOS and Google Play in 2025, up 10.6% year over year. This is a narrower app-store spending benchmark, not an advertising-inclusive global market total. Sensor Tower
US$155.8 billion: Appfigures estimates 2025 consumer spending across App Store and Google Play apps and games at this level, up 21.6% year over year. Treat it as a separate estimate with a different methodology from Sensor Tower’s. TechCrunch’s report on Appfigures
More than US$1.4 trillion: Apple says its App Store ecosystem facilitated this amount in developer billings and sales in 2025, including US$1.1 trillion in physical goods and services, US$149 billion in digital goods and services, and US$151 billion in in-app advertising. It measures ecosystem-facilitated commerce, not the global mobile app market. Apple
528.48 billion downloads: Statista forecasts this worldwide download count for 2026. Downloads are installations, not unique users, active users, or revenue.

Get the Mobile Testing Playbook Used by 800+ QA Teams
Discover 50+ battle-tested strategies to catch critical bugs before production and ship 5-star apps faster.
Define the denominator before using a market-size figure
“Mobile app market” commonly refers to three different measures. The table separates them so you do not compare unlike figures.
Measure | What it counts | Useful for | Example |
Broad app-market revenue | Modeled IAP, paid app purchases, and advertising | A high-level forecast of monetization | Statista’s US$739.61B forecast for 2026 |
Direct app-store spending | Purchases, subscriptions, paid apps, and games measured through specified stores | Store-based consumer monetization | Sensor Tower’s US$167B 2025 iOS-and-Google-Play benchmark |
App-store-facilitated ecosystem commerce | Digital goods, physical goods and services, and in-app advertising enabled through a platform | The commercial activity an app-store ecosystem supports | Apple’s more-than-US$1.4T 2025 App Store measure |
A direct-spending estimate is not necessarily wrong because it is lower than a broad app-market forecast. It may exclude advertising, off-store transactions, or stores outside its coverage. Similarly, Apple’s ecosystem figure is not a larger estimate of the same revenue pool: most of it is physical goods and services.
Why 2026 app market estimates range from US$322.6B to US$739.61B
The three headline 2026 forecasts should be read as distinct models, not as a consensus range. Statista’s US$739.61 billion model includes B2C IAP, paid apps, and advertising. Mordor Intelligence forecasts US$391.30 billion, while Grand View Research estimates US$322.6 billion. Each publisher sets its own boundaries and applies proprietary methods.
Publisher | 2026 figure | Later forecast | What the figure is |
Statista | US$739.61B | US$1.095T in 2031; 8.17% CAGR for 2026–2031 | Broad modeled worldwide app-market revenue |
Mordor Intelligence | US$391.30B | US$864.5B in 2031; 17.18% CAGR for 2026–2031 | Proprietary modeled mobile-application-market estimate |
Grand View Research | US$322.6B | US$885.3B in 2033; 15.5% CAGR for 2026–2033 | Proprietary modeled mobile-application-market estimate |
Do not average those figures. Averaging would create a precise-looking number that no source published and would hide the scope differences a reader needs to evaluate.
Use 2025 spending benchmarks for the latest observed context
Forecasts answer where a publisher expects the market to go. The latest reported store-spending measures give you a different, narrower view of what happened in 2025.
Sensor Tower reports nearly 150 billion downloads and 5.3 trillion hours spent across iOS and Google Play apps in 2025, alongside its US$167 billion IAP-revenue measure. These are engagement and spending metrics for specified stores, not a complete count of all global app activity. Sensor Tower
Appfigures’ estimate is 106.9 billion downloads across the App Store and Google Play in 2025, down 2.7% year over year, alongside its US$155.8 billion consumer-spending estimate. The different download and spending totals show why methodology and store coverage must stay attached to each number. TechCrunch’s report on Appfigures
Apple provides a separate platform view: it reports more than 850 million average weekly App Store users across 175 countries and regions in 2025. That is a reach metric for Apple’s store, not a count of global mobile-app users. Apple
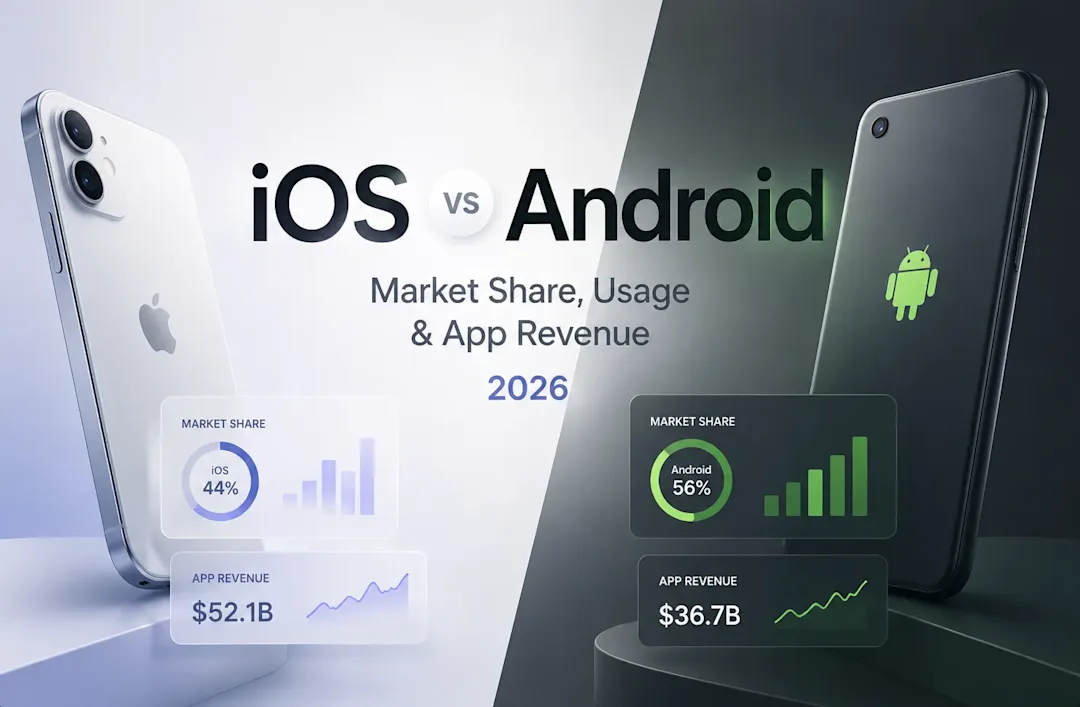
For a platform-by-platform view of revenue and usage rather than a whole-market estimate, see these iOS and Android market-share and revenue statistics.
Separate monetization, downloads, users, and engagement
A credible app market analysis keeps four units apart:
Revenue is money from a defined monetization set, such as IAP, paid apps, or advertising.
Downloads are installations. They do not identify unique people or continuing use.
Users describe a defined active audience, such as Apple’s average weekly App Store users.
Engagement measures time or sessions, not market value.
Statista’s 2026 forecast makes the revenue distinction visible: US$475.84 billion from IAP, US$6.90 billion from paid apps, and US$256.87 billion from advertising. Its advertising component is a modeled estimate; this report does not combine it with store-spending data from another methodology.
IAP itself is not synonymous with every subscription transaction. Apple documents consumable, non-consumable, auto-renewable subscription, and non-renewing subscription IAP types. A subscription paid outside an app store may therefore fall outside an app-store IAP dataset. Apple Developer
Read the 2030 and 2031 outlooks by scope
Long-range forecasts also use different denominators. Keep them in separate lanes.
Source | Period | Forecast | Scope and evidence type |
Statista | 2026–2031 | US$1.095T in 2031 | Broad app-market-revenue forecast |
Mordor Intelligence | 2026–2031 | US$864.5B in 2031 | Proprietary modeled market forecast |
Grand View Research | 2026–2033 | US$885.3B in 2033 | Proprietary modeled market forecast |
data.ai, republished by Sensor Tower | 2021–2030 | US$2.2T in direct spending over the decade; US$288B in in-app spending in 2030 | Direct app-store-spending forecast |
Sensor Tower identifies the final row as data.ai’s forecast and says it covers consumer spending through app stores, including Google Play. It is not a projection of advertising-inclusive app-market revenue. Sensor Tower
Account for coverage gaps before claiming a global total
No public figure in this report reconciles every potentially relevant stream—store spending, advertising, off-store subscriptions, third-party Android stores, and app-facilitated physical commerce—into a single audited 2026 total. That is an evidence limitation, not a reason to manufacture a composite number.
China illustrates the coverage problem. Google Play is unavailable in China, while third-party Android app stores account for a large part of that market, according to AppInChina. An iOS-and-Google-Play dataset should therefore not be presented as automatically complete all-store global coverage. AppInChina
Statista’s broad model also has boundaries: it does not turn subscriptions paid outside IAP, B2B or C2C app sales, or custom apps unavailable through official stores into the same denominator. Apple’s ecosystem measure has the opposite problem for a revenue slide: its US$1.1 trillion physical-goods-and-services component is too broad to label as app revenue.
Methodology and source notes
This report preserves the publisher’s measurement label rather than converting every figure into “market size.” Forecasts from Statista, Mordor Intelligence, Grand View Research, and data.ai remain forecasts. Sensor Tower and Appfigures supply 2025 store-spending estimates. Apple supplies an App Store ecosystem disclosure and App Store reach data.
No totals were reconstructed or added across publishers. Quash has no first-party telemetry that measures global mobile-app market size, so this report does not claim that proprietary data validates or adjusts any external estimate.
Conclusion
For a 2026 headline, Statista’s US$739.61 billion forecast is a useful starting point when you mean its broad modeled definition of app-market revenue. It is not a universal answer.
Choose the denominator that matches your decision: direct app-store spending for monetization, platform-facilitated commerce for ecosystem activity, and a clearly labeled forecast for market planning. Put the definition beside the number, and your market-size claim will remain useful when someone checks the source.
Continue reading
More articles from the Quash editorial desk.