How to Inspect Element on Android: A Complete Guide for QA Engineers

Last updated: April 2026 — Covers Appium 2.x, Android 13, 14 & 15, and Android Studio Hedgehog+
What "Inspect Element" Means on Android
If you're a QA engineer coming from web testing, you already know the browser workflow: right-click, hit Inspect, and you've got the full DOM in front of you. On Android, it's a different story — and a common source of frustration when you're trying to write automation scripts or debug failing tests.
There is no universal "right-click Inspect" on Android. Native apps don't expose a DOM. Instead, the UI hierarchy is made up of Android View objects — and you need the right tool to surface them.
Inspecting an element on Android means examining the properties of a UI component, including:
resource-id
— the developer-assigned ID (e.g.
com.example.app:id/loginButton)class name
— the View type (e.g.
android.widget.Button)
bounds
— the element's position and size on screen
content-desc
— the accessibility description (maps to
accessibility idin Appium)
XPath
— a path expression to locate the element in the view hierarchy
text
— visible text content of the element
clickable / scrollable / enabled
— interaction state
For QA engineers, these attributes are the foundation of every test locator you write — whether you're using Appium, Espresso, UI Automator, or any other framework.

Get the Mobile Testing Playbook Used by 800+ QA Teams
Discover 50+ battle-tested strategies to catch critical bugs before production and ship 5-star apps faster.
Can You Inspect Any Android App?
Before picking a method, you need to know what you're working with. Not all apps are equally inspectable.
Situation | What works |
You have the APK but no source code | Appium Inspector, UIAutomatorViewer, ADB shell |
You own the app and have the source | All methods — Layout Inspector is most powerful |
Third-party production app (Instagram, Uber, etc.) | Limited — native elements are protected by default |
Hybrid app or app with WebView content | Chrome DevTools via
|
Website in Chrome on Android | Chrome DevTools remote debugging |
Key point for QA engineers: Unlike browsers where you can inspect any webpage, native Android apps protect their UI hierarchy by default. Most inspection tools work through Android's accessibility layer — which means you can inspect the majority of apps without source code, but apps with anti-tampering measures (like banking apps) may block inspection tools entirely.
Quick Tool Comparison — Pick the Right Method
Tool | No source code? | Native app? | WebView / hybrid? | Emulator? | Best for |
Appium Inspector | ✅ | ✅ | ✅ | ✅ | QA engineers writing automation scripts |
UIAutomatorViewer | ✅ | ✅ | ❌ | ✅ | Quick element ID lookup, no setup |
ADB shell | ✅ | ✅ | ❌ | ✅ | Power users, CI/CD pipelines |
Chrome DevTools | ✅ | ❌ | ✅ | ✅ | WebView content in hybrid apps |
Layout Inspector | ❌ Needs debuggable build | ✅ | ✅ | ✅ | Developers debugging their own app |
Logcat | ❌ Needs source code | ✅ | ✅ | ✅ | Runtime log debugging |
Method 1: Appium Inspector (Best for QA Engineers — No Source Code Needed)
When to use: You're writing or debugging automation test scripts and need to find element locators. You have the APK but not necessarily the source code.
Appium Inspector is the closest equivalent to browser DevTools for Android native apps. It connects to your app through Android's accessibility layer, so it works on apps you don't own — without needing a debuggable build. For QA engineers, this is usually the first tool to reach for.
What you need
Node.js installed
Appium 2.x (
npm install -g appium)
UiAutomator2 driver (
appium driver install uiautomator2)
Appium Inspector desktop app (
)
An Android device or emulator with USB Debugging enabled
Step 1 — Start the Appium server
Open your terminal and run:
appium
You should see: Appium REST http interface listener started on 0.0.0.0:4723
Step 2 — Configure your desired capabilities
Open Appium Inspector and enter these capabilities:
{"platformName": "Android","appium:automationName": "UiAutomator2","appium:deviceName": "your_device_or_emulator_name","appium:appPackage": "com.example.yourapp","appium:appActivity": ".MainActivity"}
To find your app's package name and activity, run:
adb shell dumpsys window | grep -E 'mCurrentFocus|mFocusedApp'
Step 3 — Start a session
Click Start Session. After a few seconds you'll see:
Application Preview
— a live screenshot of your app
Element Hierarchy
— the full UI tree (equivalent to the DOM in web testing)
Element Properties
— resource-id, class, text, bounds, content-desc, accessibility ID, XPath
Step 4 — Find and validate your locators
Click any element in the screenshot or tree. Appium Inspector shows every usable locator. Use this priority order:
resource-id
— most stable, developer-assigned. Use when available.
accessibility id
— maps to
content-descon Android. Also works on iOS — great for cross-platform test suites.
text
— use only if the text is guaranteed never to change.
XPath
— very flexible, but fragile. Use only as a last resort.
You can also record user flows — Appium Inspector captures taps, swipes, and input, then generates code snippets in Java, Python, or JavaScript.
Pro tip: Always prefer
resource-idoraccessibility idover XPath. XPaths break whenever the layout changes. If neither is available, raise a bug with the developer to addandroid:idorcontentDescriptionto the element — it will make your test suite far more stable.
Method 2: UIAutomatorViewer (Quick Lookup, No Appium Setup)
When to use: You need a fast element ID lookup and don't want to go through Appium setup. UIAutomatorViewer ships with Android Studio — if you have Android Studio installed, you already have it.
It works on any running app on a connected device, no source code required.
How to open UIAutomatorViewer
Mac/Linux:
~/Library/Android/sdk/tools/bin/uiautomatorviewer
Windows:
C:\Users\YourName\AppData\Local\Android\Sdk\tools\bin\uiautomatorviewer.bat
How to use it
Connect your Android device via USB with USB Debugging enabled
Open the app you want to inspect on your device
Launch UIAutomatorViewer
Wait a few seconds — it captures a screenshot and dumps the full UI hierarchy
Hover over any element in the screenshot
The right panel shows:
resource-id,
class,
text,
content-desc,
bounds,
clickable,
scrollable,
enabled, and more
Choosing the right locator
Use this priority order for your automation scripts:
resource-id
— stable, developer-assigned, best choice
content-desc
(accessibility ID) — second best, also works cross-platform
text
— only if it never changes across locales or builds
bounds
— absolute last resort; breaks across different screen sizes
Note: UIAutomatorViewer is an older tool and has known compatibility issues with Android 12 and above. If it crashes or shows a blank screen, switch to Appium Inspector instead.
Method 3: ADB Shell Commands (For CI/CD and Power Users)
When to use: You're comfortable with the command line, or you need inspection that works inside a CI/CD pipeline without a GUI.
ADB (Android Debug Bridge) gives you direct access to the device's UI hierarchy as an XML dump — no desktop app needed. This is useful for automated scripts that need to verify element presence as part of a build pipeline.
Dump the full UI hierarchy
adb shell uiautomator dump /sdcard/ui_dump.xmladb pull /sdcard/ui_dump.xml ./ui_dump.xml
Open ui_dump.xml in any text editor or XML viewer. Every element on screen appears with its full attributes: resource-id, text, class, bounds, content-desc, scrollable, clickable, and more.
Find a specific element
adb shell uiautomator dump /sdcard/dump.xml && adb shell cat /sdcard/dump.xml | grep "Login"
Useful ADB commands for QA work
# Find what app is currently in the foregroundadb shell dumpsys window | grep -E 'mCurrentFocus'# List all installed packagesadb shell pm list packages# Get screen resolutionadb shell wm size# Take a screenshotadb shell screencap /sdcard/screen.png && adb pull /sdcard/screen.png# Watch live logsadb logcat# Filter logs by your app's packageadb logcat | grep "com.yourapp.package"
Method 4: Chrome DevTools for WebView and Hybrid Apps
When to use: Your app is a hybrid app (React Native with WebView, Cordova, Ionic, or any app embedding a WebView component). Chrome DevTools lets you inspect the web layer inside the app exactly like inspecting a website.
How to tell if your app uses WebView: If parts of the app look like HTML/CSS rendering, or if the app was built with Cordova, PhoneGap, or uses in-app browsers — it likely has WebView content.
Step 1 — Enable WebView debugging (app owners only)
If you control the source code, add this to your app:
// In your Application class or Activityif (Build.VERSION.SDK_INT >= Build.VERSION_CODES.KITKAT) {WebView.setWebContentsDebuggingEnabled(true);}
Step 2 — Connect via Chrome DevTools
Connect your Android device via USB with USB Debugging enabled
Open Google Chrome on your desktop
Navigate to
chrome://inspect/#devicesYour device appears, along with any active WebViews in running apps
Click
Inspect
next to the WebView you want to examine
You'll get the full Chrome DevTools panel — Elements, Console, Network, Sources — working directly on your app's WebView content.
What you can do
Elements panel
— inspect and live-edit HTML and CSS inside the WebView
Console
— run JavaScript directly in the app's WebView context
Network tab
— monitor API calls, headers, payloads, and response times
Sources
— set breakpoints in JavaScript running inside the app
Important limitation for QA: Chrome DevTools only works on the web layer. It cannot see native Android UI elements like
Toolbar,BottomNavigationView, or any View defined in XML layouts. For those, use Appium Inspector.
Method 5: Android Studio Layout Inspector (Best for Developers)
When to use: You're debugging the app's own layout — you have the source code and can build a debug APK. This is primarily a developer tool, but QA engineers working closely with a development team may find it useful for diagnosing visual rendering bugs.
What you need
Android Studio
A debuggable build of the app (
debuggable truein
build.gradle)
An Android device or emulator with USB Debugging enabled
Make the app debuggable
In your build.gradle (app-level):
android {buildTypes {debug {debuggable true}}}
Security warning: Never ship a production build with
debuggable true. It exposes your app to reverse engineering and is a critical security vulnerability. Restrict this to debug or staging builds only.
Steps
Run your app on a connected device
In Android Studio, go to
View → Tool Windows → Layout Inspector
Select your device and process from the dropdowns
Click any element in the Layout Display to select it
The
Component Tree
(left) shows the full view hierarchy; the
Attributes panel
(right) shows every property — width, height, padding, margin, text, color, visibility, and more
Use
Deep Inspect mode
to select overlapping views by right-clicking in a region
Enable
3D view
(take a snapshot first) to see how layers stack visually
Quick layout bounds overlay
Without connecting to Android Studio, you can enable a visual outline on any debuggable device:
Settings → Developer Options → Show Layout Bounds → ON
This puts an outline around every UI element on screen — useful for quickly spotting alignment issues, unexpected padding, or clipping.
Method 6: Logcat for Runtime Debugging
When to use: You want to monitor what's happening inside the app at runtime — errors, crashes, custom log messages, or event flows. Particularly useful when a test is failing and you need to understand why at the application level.
Logcat is Android's live logging system — a real-time feed of everything the app and Android system outputs.
Using Logcat in Android Studio
Go to
View → Tool Windows → Logcat
Select your device from the dropdown
Filter by package name, tag (e.g.
OkHttp,
Retrofit,
MyActivity), or log level
Log levels to watch
Level | What it means |
— Verbose | Detailed diagnostic info |
— Debug | Development-phase debug messages |
— Info | Normal operation milestones |
— Warning | Something unexpected but non-fatal |
— Error | Errors and exceptions — always investigate these |
Red entries in Logcat = errors or crashes. Always start debugging there.
Using Logcat via ADB
# Live all logs
adb logcat

# Filter by tag
adb logcat -s MyAppTag
# Filter by priority (E = errors only)
adb logcat *:E
# Save to file
adb logcat > logcat_output.txt
Method 7: Network Profiler & OkHttp Interceptor {#method-7-network-profiler}
When to use: You need to inspect API calls — what requests the app makes, what headers are sent, what the server responds with, and how long requests take. Useful for validating API contract tests or debugging integration issues.
Option A — Android Studio Network Profiler
Run your app in Android Studio
Open
View → Tool Windows → Profiler
Click on your app process → select
Network
Trigger network activity in the app
Click any request to see: URL, method, headers, request body, response code, response body, and timing
Option B — OkHttp Logging Interceptor
If the app uses OkHttp (most Android apps do), add the logging interceptor to surface all requests in Logcat.
Add the dependency in build.gradle:
dependencies {implementation 'com.squareup.okhttp3:logging-interceptor:4.12.0'}
Configure your OkHttpClient:
HttpLoggingInterceptor logging = new HttpLoggingInterceptor();logging.setLevel(HttpLoggingInterceptor.Level.BODY);OkHttpClient client = new OkHttpClient.Builder().addInterceptor(logging).build();
All network requests and responses appear in Logcat — every header, request body, and response. This is invaluable when verifying that your test actions trigger the correct API calls.
When to use each option
Network Profiler
— best for visual, interactive inspection during manual exploratory testing
OkHttp Interceptor
— best for logging all calls during automated test runs, especially when piped to a log file
How to Inspect Elements on an Android Emulator
Don't have a physical device? Every method above works equally well on the Android Emulator (AVD) inside Android Studio.
Setting up an emulator
In Android Studio, go to
Tools → Device Manager
Click
Create Virtual Device
Choose a device profile (e.g. Pixel 6) and an Android version (API level)
Click
Finish
and start the emulator
Tool-specific notes for emulators
Appium Inspector
— set
appium:deviceNameto your AVD name (find it with
adb devices)
UIAutomatorViewer
— run
adb devicesfirst to confirm the emulator is visible
ADB commands
— all commands work on emulators; the device name looks like
emulator-5554Chrome DevTools
— works identically; the emulator appears in
chrome://inspect
Testing tip: Create multiple AVDs with different API levels (API 28, 31, 33, 34) to catch Android version-specific bugs early. Layout and behavior differences across Android versions are one of the most common sources of test failures in CI.
Common Errors & Troubleshooting
Device not appearing in Android Studio or ADB
Causes and fixes:
USB Debugging is not enabled → re-enable in Developer Options
Driver issue on Windows → install the official OEM USB driver for your device
Wrong USB mode → change connection mode to "File Transfer" (MTP), not "Charging only"
Stale ADB server → run
adb kill-serverthen
adb start-server, then reconnect
Verify with: adb devices — your device should show as [serial] device, not offline
Appium Inspector: session fails or times out
Causes and fixes:
Appium server not running → make sure
appiumis running in terminal before starting Inspector
Wrong
appPackageor
appActivity→ recheck with
adb shell dumpsys window | grep mCurrentFocusUiAutomator2 driver not installed → run
appium driver install uiautomator2Device not found → confirm
adb devicesshows the device
Port conflict → change server port in Appium settings if 4723 is in use
UIAutomatorViewer crashes or shows a blank screen
Causes and fixes:
Java version mismatch → UIAutomatorViewer requires Java 8; check
java -versionAndroid 12+ compatibility → UIAutomatorViewer has known issues with newer Android versions; use Appium Inspector instead
No device connected → ensure
adb devicesshows your device
Layout Inspector shows empty or loads forever
Causes and fixes:
App not marked
debuggable true→ fix
build.gradleand reinstall
Android Studio version too old → update to the latest stable version
Activity needs a restart → click
Stop
in Layout Inspector then re-launch the activity
chrome://inspect doesn't show the app's WebView
Causes and fixes:
WebView debugging not enabled in app code → add
WebView.setWebContentsDebuggingEnabled(true)App not in the foreground → make sure the WebView is actively displayed on screen
Custom/non-Chromium WebView → some apps use non-standard WebViews that Chrome DevTools can't connect to
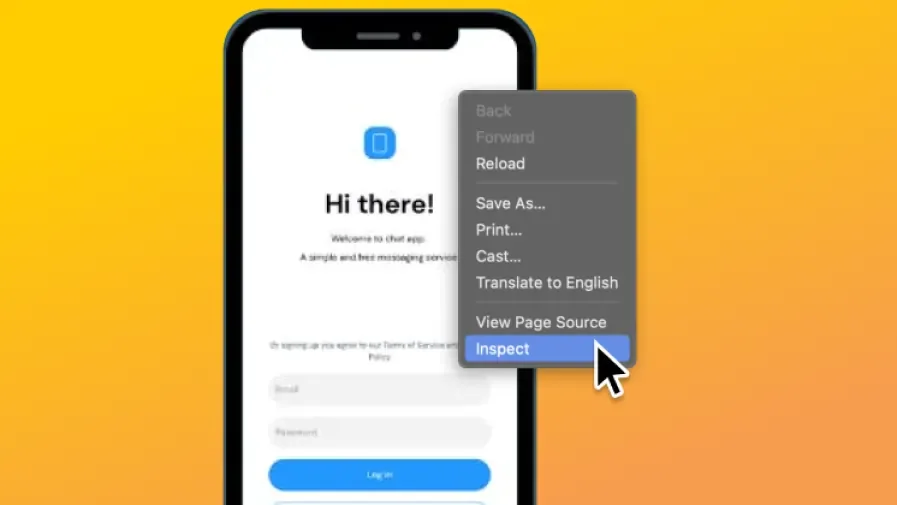
How to Inspect Element in Chrome on Android Mobile
If you're trying to inspect a website (not a native app) on your Android phone, Chrome makes this straightforward using remote debugging from your desktop.
What you need
A desktop or laptop with Google Chrome installed
Your Android phone with USB debugging enabled
A USB cable
Steps
Step 1 — Enable USB Debugging on your phone Go to Settings → About Phone → tap Build Number 7 times to unlock Developer Options → go back to Settings → Developer Options → turn on USB Debugging.
Step 2 — Connect your phone to your desktop Use a USB cable. When prompted on your phone, tap "Allow USB Debugging."
Step 3 — Open chrome://inspect on your desktop In your desktop Chrome browser, type chrome://inspect/#devices in the address bar and hit Enter.
Step 4 — Open the website on your phone On your Android phone, open Chrome and navigate to the website you want to inspect.
Step 5 — Click Inspect Your phone and the open tab will appear in the chrome://inspect page on your desktop. Click Inspect below the tab name. The full Chrome DevTools panel opens — you can inspect elements, edit CSS, and monitor network calls just like on desktop.
What you can do
Elements panel
— view and live-edit the HTML and CSS of any webpage
Console
— run JavaScript directly on the mobile page
Network tab
— monitor API calls and load times
Device toolbar
— simulate different screen sizes
Note: This method only works for websites and web content. If you need to inspect a native Android app's UI elements, scroll up to Method 1 (Appium Inspector) instead.
FAQ
Q: Can I inspect any Android app without the source code?
Yes — for most apps. Appium Inspector and UIAutomatorViewer both work through Android's accessibility layer and don't require source code. However, some apps use anti-tampering measures that block inspection tools. Production-hardened apps (like banking apps) may detect and block them entirely.
Q: What is the equivalent of Chrome DevTools for native Android apps?
For apps you own, Android Studio's Layout Inspector is the closest equivalent. For any app (including third-party), Appium Inspector is the best equivalent — it shows a visual element hierarchy with all properties, similar to the Elements panel in Chrome DevTools.
Q: How do I find the resource-id of a UI element?
Use UIAutomatorViewer or Appium Inspector — both show the resource-id attribute when you click an element. The format is typically com.example.app:id/elementName. You can also use ADB:
adb shell uiautomator dump /sdcard/dump.xml && adb pull /sdcard/dump.xml
Then search the XML for the element's text or class name.
Q: Can I inspect Android elements without a USB cable?
Yes, via wireless ADB (Android 11+):
Enable
Wireless debugging
in Developer Options
Run
adb pair <ip:port>using the pairing code shown on screen
Then
adb connect <ip:port>to connect
All inspection tools then work over Wi-Fi, no USB needed.
Q: What is the difference between resource-id, accessibility ID, and XPath in Appium?
resource-id
— the
android:idset by the developer in XML layout. Most stable. Use first.
accessibility id
— maps to
contentDescriptionon Android. Works cross-platform (Android + iOS). Use second.
XPath
— a path expression to locate the element in the UI hierarchy. Very flexible, but brittle — breaks whenever the layout changes. Use only when no ID is available.
Q: How do I inspect elements on a remote real device (BrowserStack, LambdaTest)?
Cloud testing platforms provide their own built-in mobile inspector during a session. You can also use Appium Inspector connected to the platform's remote Appium server — set the remote host, port, and add your credentials to the Appium capabilities.
Q: Does this work on React Native apps?
Yes. React Native apps are native apps, so Layout Inspector and Appium Inspector both work on the native layer. For the JavaScript/React layer, use React Native Debugger or Flipper — they let you inspect the component tree, view props and state, and monitor network calls at the React level.
Q: How do I verify my locator before writing the test script?
In Appium Inspector, use the Find function. Enter the locator strategy (e.g. id) and value (e.g. com.example.app:id/loginButton) and click Find Element. Inspector highlights the matched element on the app screenshot — confirming your locator is correct before you write a single line of test code.
Q: How do I inspect elements on Android without a computer?
For basic inspection directly on the device, you can use Play Store apps like UI Inspector or Accessibility Scanner. However, for automation-grade details like resource-id and XPath, a desktop connection via Appium Inspector or ADB is required — there's no fully equivalent on-device alternative.
Q: How do I inspect elements in a Flutter app on Android?
Flutter apps render using their own engine and don't expose standard Android View attributes, so tools like Appium Inspector and UIAutomatorViewer won't work on Flutter's native layer. Use Flutter Inspector built into Android Studio or Dart DevTools instead — these are purpose-built for Flutter's widget tree.
TL;DR Cheat Sheet
Your situation | Use this |
QA tester, need element locators for automation | Appium Inspector |
Quick element ID lookup, no Appium setup | UIAutomatorViewer |
Command-line / CI pipeline inspection | ADB shell (
) |
Inspecting WebView or hybrid app content | Chrome DevTools via
|
Developer debugging their own app's layout | Android Studio Layout Inspector |
Monitoring runtime logs and crashes | Logcat (Android Studio or ADB) |
Inspecting API calls and network requests | Network Profiler or OkHttp Interceptor |
No physical device | Use Android Emulator (AVD) with any method above |
Testing on iOS instead? See our complete guide: How to Inspect Elements on iPhone → Key takeaway: Inspecting elements on Android isn't as instant as right-clicking on a webpage — but with the right tool it's just as powerful. For QA engineers, the most productive combination is Appium Inspector for locators, Logcat for runtime behavior, and Chrome DevTools for any WebView content. Master these three and you'll be able to debug or automate almost any Android app you encounter.
Continue reading
More articles from the Quash editorial desk.

