Dating App Statistics (2026)

You are choosing a number for a deck, a story, or a market brief—and the obvious figures measure very different things. The cleanest current U.S. benchmark is that 37% of adults had ever used an online dating site or app, while 6% were current users, according to SSRS’s January 2026 nationally representative survey of 2,012 adults.
That is the short answer for anyone looking for dating app statistics in 2026: online dating has broad lifetime reach, but current use is a much smaller snapshot. The sections below keep adoption surveys, app-use recall, company payers, revenue, relationship outcomes, and scam reports in their own lanes so you can cite each figure without turning it into something it does not measure.
Key dating app statistics for 2026
37% of U.S. adults aged 18 or older had ever used an online dating site or app, and 6% were current users in SSRS’s January 2–4 and 16–20, 2026 survey. The nationally representative sample contained 2,012 adults; SSRS reports a ±2.5 percentage-point margin of error at the 95% confidence level. SSRS’s 2026 report is the primary source.
51% of U.S. adults aged 18–29, 53% aged 30–49, and 20% aged 50 or older had ever used an online dating site or app in that 2026 SSRS survey. Current use was 10%, 8%, and 2%, respectively.
63% of LGBTQIA+ U.S. adults had ever used an online dating site or app, compared with 34% of non-LGBTQIA+ adults, according to SSRS’s 2026 survey. Current use was 14% and 4%, respectively.
48% of SSRS’s 2026 ever-users reported having used Tinder; 30% reported Plenty of Fish; 30% Facebook Dating; 27% Bumble; and 21% each Hinge and Match. These are overlapping lifetime-use reports among ever-users, not market share, monthly active users, or downloads.
Bumble reported FY2025 revenue of $965.7 million, down 9.9% year over year, and 3.7 million paying users, down 11.5%. The period ended December 31, 2025.
Match Group reported FY2025 revenue of $3.5 billion, flat year over year. Tinder direct revenue was $1.9 billion, down 4%, while Hinge direct revenue was $691 million, up 26%.
40% of current dating-app users in a U.S. survey said scammers had targeted them, and 41% of those targeted said they fell victim. Gen commissioned Dynata to survey 1,001 U.S. adults from December 5–16, 2024; these are self-reports, not incident counts.

Get the Mobile Testing Playbook Used by 800+ QA Teams
Discover 50+ battle-tested strategies to catch critical bugs before production and ship 5-star apps faster.
How U.S. dating-app use changed from 2024 to 2026
SSRS provides the most comparable recent U.S. series in this evidence set. Its nationally representative surveys recorded 37% lifetime use and 7% current use in 2024; 39% and 7% in 2025; and 37% and 6% in 2026. The 2024 survey covered 2,011 U.S. adults and was fielded January 5–7 and 19–21. The 2025 survey covered 2,016 adults and was fielded February 7–9. See SSRS’s 2024 report and its 2025 report for the earlier waves.
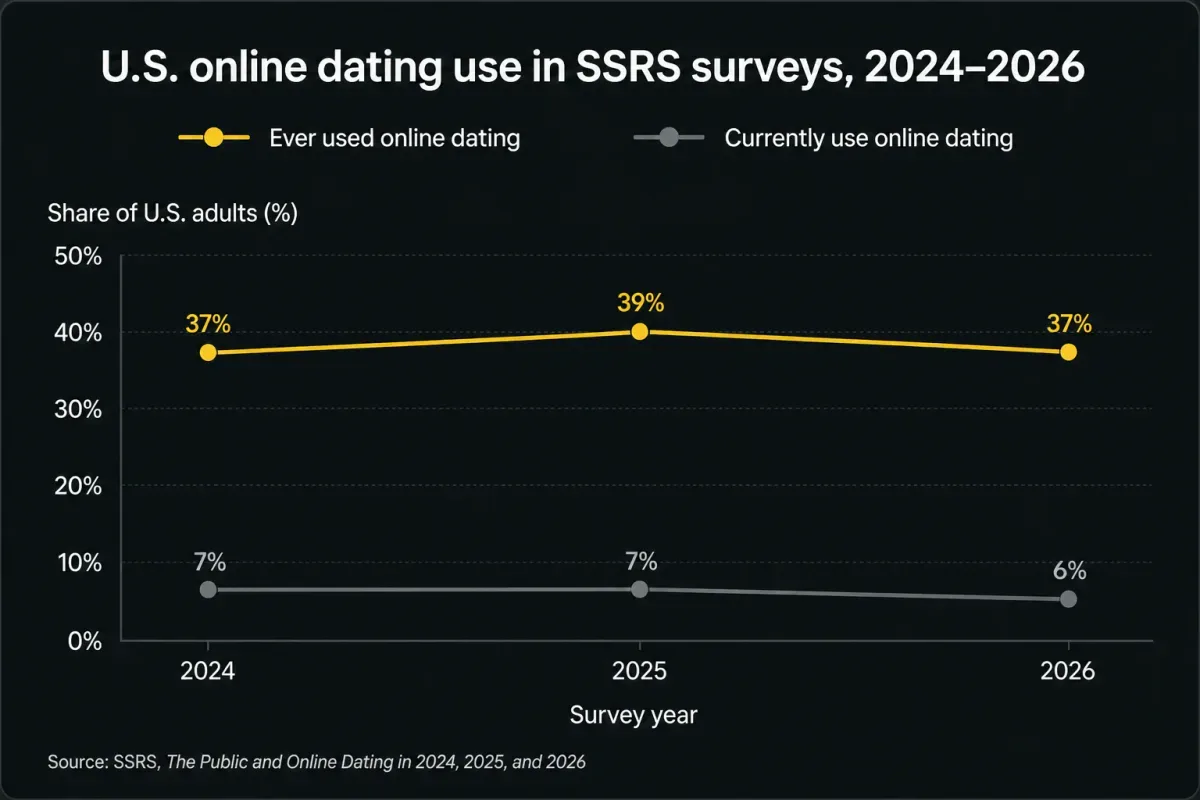
These are repeated cross-sectional surveys, not a panel following the same people. You can accurately describe a narrow range across the three surveys; you cannot infer a statistically significant increase or decrease from these figures alone.
Who reports using dating apps?
The 2026 SSRS results show substantial age and identity differences. Adults aged 30–49 had the highest lifetime-use figure at 53%, narrowly above the 51% reported among adults aged 18–29. Yet current use was higher among 18–29-year-olds, at 10% versus 8%. For adults aged 50 or older, lifetime use was 20% and current use was 2%.
SSRS also found that 63% of LGBTQIA+ adults reported lifetime use and 14% current use, compared with 34% and 4% among non-LGBTQIA+ adults. Both comparisons refer to U.S. adults in the January 2026 survey, not to all people who use dating services globally.
For historical context, a probability-based Pew Research Center survey fielded July 5–17, 2022 among 6,034 U.S. adults found lifetime use of 53% among adults under 30, 37% among adults aged 30–49, 20% among those 50–64, and 13% among those 65 or older. Treat that as a dated benchmark with different age bands, not as another point in the SSRS trend.
Which dating sites and apps do people remember using?
SSRS asked people who had ever used an online dating site or app which services they had used. In the 2026 results, Tinder had the highest reported lifetime use at 48%, followed by Plenty of Fish and Facebook Dating at 30% each, Bumble at 27%, and Hinge and Match at 21% each.
Those percentages overlap: someone who has used Tinder and Hinge belongs in both groups. They therefore cannot establish which service has the most active users, the largest revenue base, or the most downloads.
The pattern varies by age among ever-users. For ages 18–29, SSRS reported Tinder at 74%, Bumble at 49%, and Hinge at 44%. For ages 30–49, the leading reported services were Tinder at 46%, Plenty of Fish at 38%, and Facebook Dating at 33%. Among ever-users aged 50 or older, Plenty of Fish was 36%, Match 33%, and Facebook Dating 28%.
What do relationship and experience statistics show?
Pew’s 2022 survey found that one in ten partnered U.S. adults—people married, living with a partner, or in a committed romantic relationship—said they met their current significant other through a dating site or app. The figure was one in five for partnered adults under 30 and about one in four for partnered LGB adults. This is an outcome among partnered adults, not a conversion rate for app users.
The same 2022 Pew survey found that 53% of ever-users described their experience as very or somewhat positive, while 46% described it as very or somewhat negative. It also found that 35% of ever-users had paid to use a dating platform. Pew defined current or recent users as the 9% of U.S. adults who had used a dating site or app in the past year; that is not the same measure as SSRS’s 6% current-use estimate for 2026.
SSRS’s 2026 questionnaire offers a separate view. Half of its ever-users said they had at some point been in a committed relationship with someone met through a dating site or app. Among those ever-users, 58% said finding an exclusive romantic partner was their main reason for using a service, while 33% said online dating had a mostly positive effect on dating and relationships. Different question wording and populations mean these findings should sit alongside, not be merged with, Pew’s measures.
Dating-app business statistics from Bumble and Match Group
Public-company results describe a paid business layer of dating services, not the number of people using dating sites. Bumble reported in its FY2025 SEC exhibit that total revenue fell 9.9% to $965.7 million for the year ended December 31, 2025, from $1.072 billion in 2024. Bumble App revenue declined 9.6% to $783.0 million. The company’s total paying users declined from 4.1 million to 3.7 million, while total average revenue per paying user rose 1.9% to $21.64.
Match Group’s FY2025 SEC exhibit reported $3.5 billion in total revenue, flat year over year. It reported 14.2 million total payers, down 5%; Tinder direct revenue of $1.9 billion, down 4%; and Hinge direct revenue of $691 million, up 26%.
Do not add Match Group’s and Bumble’s payer counts to create an industry-user estimate. Both are company-defined paying-user metrics with different portfolios and reporting scopes, and paying users are not total users or monthly active users.
Dating-app safety and scam statistics
Norton’s summary of Gen’s 2025 Cyber Safety Insights research reports that 40% of respondents currently using a dating app said scammers had targeted them. Of those respondents, 41% said they fell victim. Dynata conducted the U.S. online survey of 1,001 adults for Gen on December 5–16, 2024. Norton’s full summary also reports that 60% of current dating-app users believed they had received an AI-written conversation, 46% had reported a suspected scammer or catfish to a platform, and 29% had digitally altered profile photos.
These survey responses should not be read as prevalence counts of confirmed fraud. A separate FTC data spotlight found that nearly 60% of people who reported losing money to a romance scam in 2025 said the contact began on a social-media platform. That figure concerns reported-loss cases and their stated starting point, not all romance scams or dating-app incidents.
What public dating-app data cannot establish
No verified primary source in this evidence set provides a comparable global total of dating-app users or revenue. The available figures use incompatible units: U.S. survey respondents, people recalling lifetime service use, company-reported payers, and company revenue.
There is also no neutral public monthly-active-user or download total here, and no verified non-U.S. probability-sample adoption benchmark comparable to the SSRS series. Those gaps are why a global “dating app users” total should not be manufactured by adding company payers or borrowing a vendor estimate.
Quash has no first-party data on dating-app adoption, relationship outcomes, revenue, or safety. The useful contribution is therefore a clear boundary around the public evidence, rather than a proprietary estimate that does not exist.
Methodology and source notes
This report prioritizes primary sources: SSRS and Pew for survey findings, SEC-hosted company exhibits for Bumble and Match Group results, Norton’s first-party summary for Gen’s commissioned survey, and the FTC for reported-loss pathway data. Numbers are kept with their relevant population and period because “ever used,” “current use,” “past-year use,” “payer,” and “revenue” answer different questions.
Conclusion
If you need a defensible 2026 dating-app statistic, use the measure that fits your claim. For current U.S. adoption, cite SSRS’s 37% lifetime-use and 6% current-use results. For business performance, cite the individual company filings. For safety, identify whether the evidence is a self-reported survey or a reported-loss dataset. Your decision is not which number is largest; it is which denominator actually answers the question you are making.
Continue reading
More articles from the Quash editorial desk.