Smartphone Usage Statistics (2026): Global Users, Screen Time, App Use, and What the Numbers Mean

A request for smartphone usage statistics can hide several different questions: How many people own one? How long do they spend in apps? How dependent are they on a phone for internet access? A single number cannot answer all of them.
The short answer is that smartphone use is widespread, but the most useful 2026 figures are measured in different ways. This report separates ownership, mobile-phone scale, app time, reported screen time, downloads, spending, and attitudes so you can cite the number that actually fits your decision.
Key smartphone usage statistics for 2026
91% of U.S. adults owned a smartphone in Pew Research Center’s survey of 5,022 U.S. adults, fielded from February 5 to June 18, 2025. The same survey found that 98% owned a cellphone of any kind. This is a U.S. adult survey result, not a global adoption rate. Pew Research Center
16% of U.S. adults were smartphone-only internet users in Pew’s 2025 analysis: they owned a smartphone but did not subscribe to home broadband. This measures dependence on a smartphone for internet access, rather than smartphone ownership by itself. Pew Research Center
5.78 billion people used a mobile phone at the start of 2025, equal to 70.5% of the world’s population, according to DataReportal’s compiled global report. It separately says smartphones made up almost 87% of mobile handsets in use. Those are mobile-phone and handset measures, not a count of unique smartphone users. DataReportal
5.3 trillion hours were spent in iOS and Google Play apps during 2025, or roughly 3.6 hours per mobile user per day, according to Sensor Tower’s mobile measurement analysis. It is an app-engagement measure, not total time spent looking at a smartphone. Sensor Tower
Sensor Tower recorded nearly 150 billion downloads across iOS and Google Play in 2025. A download is an acquisition event; it is not a unique person or an active user.
The same analysis reported $167 billion in 2025 revenue from in-app purchases and paid apps and games across iOS and Google Play, 10.6% higher year over year. This is covered app-store spending, not all commerce conducted on smartphones.
6.3 hours per day was Apptopia’s estimate of U.S. mobile-phone use in December 2025, based on its U.S. consumer-panel data covering January 2023 through December 2025. It is panel-based measurement, not a self-reported survey result and not a global average. Apptopia
4 hours 5 minutes per day was the self-reported smartphone screen-time estimate in a 2026 survey of 1,000 Americans published by Reviews.org. The publisher converted responses to numeric time values, so this is a self-report estimate rather than passive device or app measurement. Reviews.org
In a Pew survey of 9,750 U.S. adults fielded May 26 through June 1, 2026, 53% said they spent too much time on their smartphone. The share was 70% among adults ages 18–29 and 25% among adults 65 and older. This measures perceived overuse, not hours of use. Pew Research Center

Get the Mobile Testing Playbook Used by 800+ QA Teams
Discover 50+ battle-tested strategies to catch critical bugs before production and ship 5-star apps faster.
Separate global mobile-phone scale from smartphone users
The broadest global figure in the reviewed evidence is DataReportal’s 5.78 billion people using a mobile phone at the start of 2025. It is valuable for showing the scale of mobile connectivity, but it should not be rewritten as “5.78 billion smartphone users.” DataReportal uses a different unit for its second figure: the share of handsets in use that are smartphones.
That distinction is more than a wording preference. A person count, a handset count, and a subscription count can each be valid while producing different totals. You should not multiply the 5.78 billion people by the almost-87% handset share to create a global smartphone-user figure that neither source published.
For a country-specific ownership benchmark, Pew’s 2025 U.S. survey is clearer: 91% of U.S. adults said they owned a smartphone. It is a survey-based ownership estimate for adults in the United States, with a stated sample and field period. It does not establish ownership rates in other countries.
Smartphone-only internet access answers a different question again. Pew’s 16% figure identifies U.S. adults who own a smartphone but lack a home-broadband subscription. If you are assessing how much a mobile experience matters to access, that measure is more relevant than ownership alone. It does not mean that 16% of adults use only a smartphone for every digital task.
How much time do people spend on smartphones?
The available time-use figures should not be averaged. They have different populations, geographies, collection methods, and scopes.
Statistic | Population and period | What it measures | Evidence type |
3.6 hours per day | Mobile users globally; 2025 | Time in iOS and Google Play apps | Sensor Tower app measurement/modeling |
6.3 hours per day | U.S. mobile-phone users; December 2025 | Mobile-phone use in Apptopia’s consumer panel | First-party consumer-panel analysis |
4 hours 5 minutes per day | 1,000 Americans; 2026 | Self-reported smartphone screen time converted to numeric values | Original survey |
53% say “too much time” | U.S. adults; May 26–June 1, 2026 | Perception of the amount of smartphone use | Pew survey |
Sensor Tower’s 3.6-hour estimate covers time spent in apps distributed through iOS and Google Play. It does not claim to capture every minute of browser use, system activity, offline activity, or app use outside that coverage. Use it when you need a global app-engagement benchmark.
Apptopia’s 6.3-hour figure is broader in its wording—mobile-phone use—but narrower in geography and panel population. Use it as a U.S. consumer-panel estimate for December 2025. It is not evidence that every smartphone owner in every country spent 6.3 hours per day on a device.
Reviews.org’s 4-hour-5-minute estimate answers yet another question: what surveyed Americans reported about their own smartphone screen time. Self-reporting can be useful for attitudes and perceived habits, but it is not interchangeable with passive panel measurement or app analytics.
The practical rule is simple: cite app time when you are discussing app engagement, panel-based phone time when you need that panel’s U.S. behavior estimate, and survey responses when perception is the relevant outcome. Do not turn them into a single worldwide “average screen time” statistic.
Smartphone ownership and access differ by age
Pew’s 2025 U.S. ownership survey found smartphone ownership among 97% of adults ages 18–29, 96% of adults ages 30–49, 90% of adults ages 50–64, and 78% of adults 65 and older. These percentages describe U.S. adults in each age group who said they owned a smartphone; they are not global adoption rates. Pew’s mobile-device fact sheet provides the full demographic breakdown and survey method.
Ownership should not be used as a proxy for internet dependence. In Pew’s 2025 analysis, 27% of adults ages 18–29, 11% of those ages 30–49, 15% of those ages 50–64, and 17% of adults 65 and older were smartphone-dependent under the source’s definition. The measure reflects a smartphone owner without home broadband, not the amount of time a person spends on a phone.
Pew’s 2026 attitudinal result points in the same direction without measuring usage duration: 70% of U.S. adults ages 18–29 said they spent too much time on their smartphone, compared with 25% of those 65 and older. That gap is about self-assessment. It does not prove a corresponding difference in measured hours.
If you are making an accessibility, product, or media decision, age-specific ownership and access measures can be more useful than a single population-wide average. They show who has a device and who may rely on it for connectivity, not necessarily how each group behaves once online.
What app activity statistics measure
App activity is a major part of smartphone usage, but downloads, time, and spending describe three separate behaviors.
Downloads measure acquisition. Sensor Tower’s nearly 150 billion downloads across iOS and Google Play in 2025 count installation or acquisition events. A single person can generate multiple downloads, and a download does not show whether an app was retained or used.
App time measures engagement. Sensor Tower’s 5.3 trillion hours and 3.6 hours per mobile user per day indicate the scale of activity inside the apps it covers. For an app publisher, that is often a more meaningful engagement input than download volume. It is still not a total-smartphone-time measure.
App-store spending measures monetized transactions. The $167 billion figure covers in-app purchases and paid apps and games across the stores in scope. It is useful for discussing the commercial scale of covered mobile apps, but it cannot tell you how many people own smartphones or how long every owner uses one.
For app planning, pair acquisition with retention rather than assuming that downloads imply sustained use. Our mobile app retention statistics explain why retention and uninstall measures answer a different question from an app-store download total.
Why smartphone market share is not smartphone usage
Smartphone market-share statistics describe the device market, usually through shipments or vendor share. Usage statistics describe what people do after they have a device. The two can inform each other, but they are not substitutes.
Counterpoint Research’s global smartphone market-share data is appropriate when you need quarterly vendor-market context. It does not measure ownership, screen time, app engagement, or mobile-web behavior.
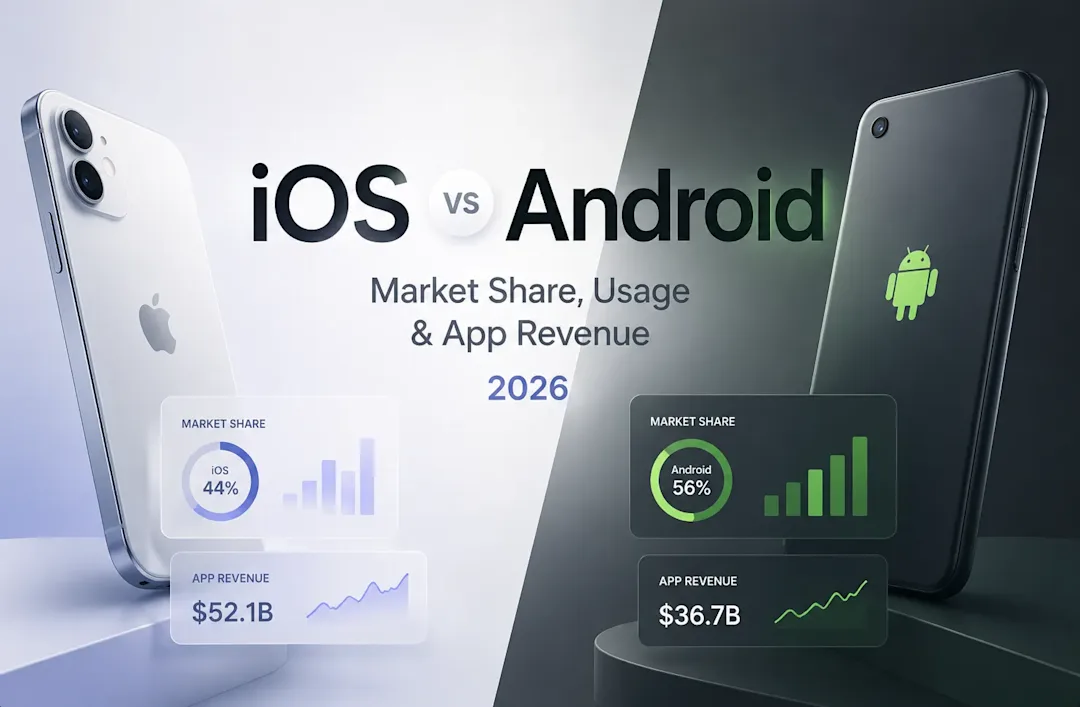
This matters when you decide where to invest in a mobile product. A regional device-share chart can help you prioritize operating-system or device coverage. It cannot establish that your audience spends more time in apps, nor can it establish that a downloaded app will retain users. For platform-level context, see our separate iOS versus Android market-share and usage statistics; keep its market and platform measures separate from the behavior figures in this report.
Why smartphone usage statistics disagree
Apparent disagreement usually comes from a mismatch in what the source counted, not necessarily an error. Before you reuse a statistic, check these five details.
Unit: Is the number counting people, phones, subscriptions, downloads, app sessions, or money?
Population: Does it cover all adults, smartphone owners, mobile users, app users, or a defined consumer panel?
Geography: Is it global, U.S.-only, or specific to a smaller market?
Period: Is the figure for a day, a month, a full year, or a particular observation month?
Evidence type: Is it survey self-reporting, passive panel measurement, app measurement/modeling, or a compiled estimate?
These labels protect you from common mistakes. Mobile web traffic is not smartphone ownership. App time is not total device time. A survey response is not a passively measured behavior trace. Quarterly vendor share is not proof of how people use their devices.
No reviewed primary source provides one compatible dataset that simultaneously measures unique smartphone users, total phone time, the split between app, web, and system activity, activities within each category, and country-by-country variation. A genuinely complete dataset would need to publish all of those dimensions with consistent definitions and a clear collection method.
Methodology and source notes
This report uses each source only for the measure it publishes. Pew supplies U.S. survey results on ownership, access dependence, and perceived overuse. Sensor Tower supplies app-store activity measures. Apptopia supplies a U.S. consumer-panel estimate of mobile-phone time. Reviews.org supplies a self-reported survey estimate. DataReportal supplies a carefully labelled compiled global mobile-phone scale figure. Counterpoint supplies market context only.
Source | Used for | Evidence type |
Pew Research Center | U.S. ownership, smartphone dependence, age differences, and perceived overuse | Primary surveys |
DataReportal | Global mobile-phone users and smartphone share of handsets | Transparent compiled report |
Sensor Tower | Covered app time, downloads, and app-store spending | First-party app measurement/modeling |
Apptopia | U.S. mobile-phone time | First-party consumer-panel analysis |
Reviews.org | U.S. self-reported smartphone screen time | Original survey |
Counterpoint Research | Vendor-market context | Specialist market-share analysis |
No first-party Quash data covers smartphone usage, so this report does not claim to measure it. The contribution here is a source-by-source distinction between numbers that are often placed together without compatible denominators.
Conclusion
Use the statistic that matches your question. For U.S. adult ownership, Pew’s 91% is the relevant reference. For global mobile connectivity scale, use DataReportal’s 5.78 billion mobile-phone users without relabelling them as smartphone users. For app engagement, use Sensor Tower’s app-time measure; for a U.S. panel estimate of mobile-phone time, use Apptopia; and for perceived overuse, use Pew’s survey result.
The decision is not which number sounds largest. It is whether the number’s population, period, and method match the claim you need to make.
Continue reading
More articles from the Quash editorial desk.