Google Play Statistics 2026

A Google Play statistic can look simple until you try to put it in a board deck or market brief. Is it a Google disclosure, an app-intelligence estimate, a count from a catalog tracker, or a number from your own Play Console account? Those measures answer different questions.
The short answer is that Google does not publish one public 2026 census of Google Play users, downloads, app inventory, and revenue. The most useful view separates Google’s platform disclosures from third-party estimates and from app-level developer reporting. This report does that so you can cite a figure without turning it into a claim it cannot support.
Google Play statistics at a glance
More than 800 million users helped become purchase-ready, cumulative to date. Google used this payment-readiness measure in its Q4 2025 update. It is not a total-user, monthly-active-user, or unique-current-user count. Google Play’s Q4 2025 update
More than 400 million paid subscriptions. Google reported this platform measure in Q4 2025; the update does not say it represents unique subscribers. Google Play’s Q4 2025 update
More than 100 billion estimated downloads in 2025. Business of Apps reports this rounded Google Play estimate, based on its cited data sources. Its terminology is downloads, not installs. Business of Apps
108.9 billion estimated installs in 2025. ASOMobile reports this separate Google Play estimate. Keep its installs label rather than merging it with another provider’s download series. ASOMobile’s 2025 mobile-market analysis
$49.2 billion estimated consumer spending in 2025. Business of Apps describes this as consumer spending on Google Play, not Alphabet-recognized revenue. Business of Apps
$52.3 billion in a 2025 Google Play revenue estimate. ASOMobile labels this provider estimate as revenue; it is not a separately disclosed Alphabet Google Play revenue line. ASOMobile’s 2025 mobile-market analysis
2,576,072 apps and 794,065 publishers. 42matters reported these Google Play catalog measurements in its 17 September 2026 snapshot. They are tracker observations, not an official Google census. 42matters
1,990,757 Android apps on Google Play. AppBrain reported this in its 16 September 2026 snapshot, another independent catalog measurement. AppBrain
More than 1.75 million policy-violating apps prevented before publication in 2025. Google reports this as pre-publication enforcement, which is different from removing an already published app. Google’s 2025 Play and Android safety report
More than 2 million apps removed in 2025, according to a secondary analysis. Surfshark attributes its calculation to Google Play transparency data. Treat it as Surfshark’s analysis, not as a directly stated Google total. Surfshark

Get the Mobile Testing Playbook Used by 800+ QA Teams
Discover 50+ battle-tested strategies to catch critical bugs before production and ship 5-star apps faster.
What does Google report directly?
Google’s public updates offer signals about commerce, safety, and developer operations, but they do not provide a single marketplace-wide ledger. That distinction matters if you are looking for a headline user count. The 800-million-plus purchase-ready measure shows that Google has helped users become able to make purchases; it does not tell you how many people currently use Google Play in a month.
The same restraint applies to subscriptions. Google’s Q4 2025 statement says the platform had more than 400 million paid subscriptions, but it does not define that figure as a count of individual subscribers. A reader with multiple subscriptions may contribute to a subscription count differently from a unique-person count.
Google’s Q2 2025 update previously described 700 million purchase-ready users. That earlier milestone should not become a calculated growth rate against the later 800-million-plus cumulative measure, because the public wording does not establish a like-for-like measurement window. Google Play’s Q2 2025 update
For historical reach rather than a current user total, a Google article published in April 2024 cited Access Partnership research about 2022 and said Google Play offered access to more than 190 markets and 2.5 billion people. That is useful context for geographic reach, but it is not a 2026 Google Play audience measurement. Google’s article on Android and Google Play reach
Google Play downloads, installs, and spending in 2025
Independent providers supply the marketplace totals that Google does not publicly disclose. Their figures are useful, but their terms and methods are not interchangeable.
Metric | Reported figure | Population and period | Evidence type | What you can say accurately |
Downloads | Over 100 billion | Google Play, 2025 | Business of Apps compilation | An estimated, rounded download total |
Installs | 108.9 billion | Google Play, 2025 | ASOMobile provider estimate | An estimated install total, using ASOMobile’s term |
Consumer spending | $49.2 billion | Google Play, 2025 | Business of Apps compilation | Estimated consumer spending, not Alphabet revenue |
Revenue | $52.3 billion | Google Play, 2025 | ASOMobile provider estimate | A provider-labelled revenue estimate |
The $49.2 billion and $52.3 billion figures are not a range to average. They are estimates from different providers using labels that are not sufficiently documented in public reporting to reconcile. The same rule applies to over 100 billion downloads and 108.9 billion installs: preserve the provider’s metric instead of presenting them as competing measurements of one precisely defined series.
Business of Apps also reports 36.2 billion game downloads and 67.7 billion non-game app downloads for Google Play in 2025. Those category figures help describe its estimate, but the provider’s store-wide headline remains over 100 billion downloads. You should not add rounded components and present the result as a new official exact total. Business of Apps
For scale context, not a Google Play total, Sensor Tower says global in-app-purchase revenue reached $167 billion in 2025 and combined iOS and Google Play downloads approached 150 billion. Appfigures, as reported by TechCrunch, estimated 106.9 billion combined App Store and Google Play downloads and $155.8 billion in combined consumer spending in 2025. These providers are measuring both major stores, so neither figure substitutes for a Google Play-only statistic. Sensor Tower’s 2026 State of Mobile TechCrunch’s report on Appfigures estimates
Alphabet’s 2025 annual filing does not separately disclose a Google Play revenue line. As a result, neither third-party spending estimate should be written as Google Play revenue recognized by Alphabet. Alphabet’s 2025 annual filing
How many apps are on Google Play?
The public answer is a pair of dated tracker snapshots, not one official app count.
Provider | Snapshot date | Reported measure | How to interpret it |
42matters | 17 September 2026 | 2,576,072 Google Play apps; 794,065 publishers | The provider’s catalog and publisher measurement |
AppBrain | 16 September 2026 | 1,990,757 Android apps on Google Play | A separate tracker’s catalog measurement |
The gap between these snapshots is not an arithmetic error for you to fix. Different trackers can apply different inclusion rules, update schedules, and definitions of an active or listed app. Use the source name and date whenever you cite either figure. 42matters AppBrain
Historical reporting indicates that the catalog changed sharply during Google’s quality-policy cleanup. In April 2025, 9to5Google reported Appfigures analysis showing a decline from roughly 3.4 million apps at the start of 2024 to about 1.8 million later in that period, described as a 47% decrease. This is reported third-party analysis, not a Google census or proof that any single policy caused the full change. 9to5Google’s report on the Play Store cleanup
If you are using catalog supply to plan a mobile release, the headline app count is only a starting point. Retention and uninstall behavior often tell you more about whether an installed app keeps earning attention; this separate report on mobile app retention and churn benchmarks covers that reader question.
Google Play safety statistics in 2025
Google’s safety report is rich in platform activity, but these are Android ecosystem protection measures rather than store-demand metrics. In 2025, Google said it prevented more than 1.75 million policy-violating apps from reaching Google Play, banned more than 80,000 harmful developer accounts, and had Play Protect scan more than 350 billion Android apps daily.
The report also says real-time scanning identified more than 27 million new malicious apps from outside Google Play in 2025. Enhanced fraud protection expanded to 185 markets covering more than 2.8 billion Android devices, while Google separately reported blocking 266 million risky installation attempts and protecting 872,000 unique high-risk applications. Each measure has its own population: device coverage is not blocked-install volume, and Android-wide scans are not Google Play downloads. Google’s 2025 Play and Android safety report
Post-publication removal is a separate measure again. Surfshark’s analysis says Google removed more than 2 million apps in 2025 using Google Play transparency data. It should remain labelled as a secondary analysis because it is not the same Google statement as the 1.75-million pre-publication prevention figure. Surfshark
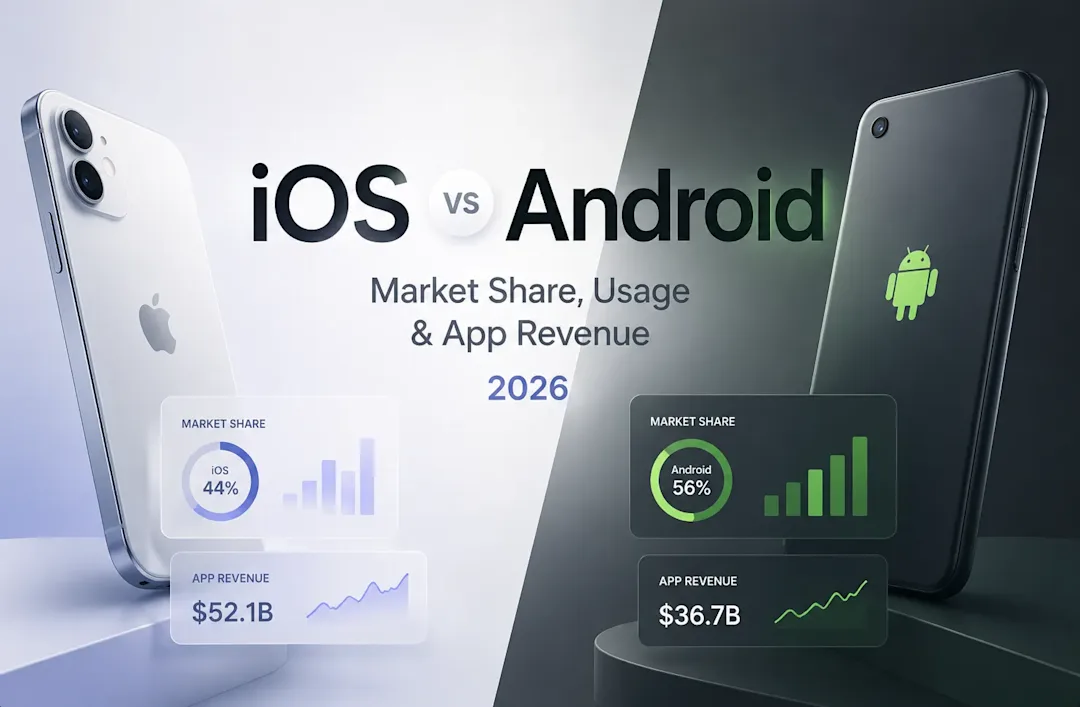
For your release process, these safety numbers are a reminder that publication is not the end of quality work. You still need to validate the flows that affect users after an update, especially where Android behavior differs from iOS. The iOS and Android market-share and app-revenue statistics provide broader platform context for that planning.
Which apps led Google Play in 2025?
Google does not publish the app-ranking estimates used here. ASOMobile’s 2025 analysis estimated that ChatGPT was the most downloaded Google Play app, with 766.7 million downloads. The same provider estimated Google One as the top-grossing Google Play app at around $2 billion and TikTok second at approximately $1.2 billion.
Those figures describe different ranking metrics: downloads measure acquisition, while a top-grossing estimate measures monetization. Keep ASOMobile’s name, the 2025 period, and the estimate qualifier attached if you reuse them. ASOMobile’s 2025 mobile-market analysis
What can you see in Play Console?
Marketplace statistics tell you about the environment around your app. Play Console tells you about your app.
Google’s Play Console Help says you can review app-specific installs, uninstalls, ratings, revenue, and crashes. The Play Console Statistics product also supports querying and comparing metrics, custom dimensions, comparisons with similar apps, and exports. Google says its reports are generated daily and accumulated in monthly CSV files. Play Console Help Google Play Console Statistics
That makes Play Console the place to investigate a release-level question such as where your installs changed, whether uninstalls rose after a release, or which markets saw more crashes. It is not a public marketplace census, and it cannot validate a third-party claim about every app in Google Play.
How should you read Google Play statistics?
Use these rules when you cite or compare a Google Play number:
Keep purchase-ready users separate from users or MAUs. Google’s measure concerns payment readiness.
Keep paid subscriptions separate from unique subscribers. The cited platform statement does not establish a unique-person count.
Keep downloads and installs in their original series. Provider wording is part of the statistic.
Keep consumer spending, provider-estimated revenue, and Alphabet revenue distinct. They are not interchangeable financial measures.
Keep pre-publication prevention and post-publication removal separate. They count different populations and cannot be added together.
Keep Play Protect activity separate from store traffic. Its scope includes Android apps outside Google Play.
Keep tracker snapshots dated and attributed. Neither catalog count is an official Google total.
These labels may feel fussy in a slide, but they are what make the figure defensible when someone asks what it actually measures.
Methodology and limits of the public record
This report prioritizes Google’s own pages for Google statements, uses provider-labelled estimates where Google does not publish a marketplace total, and treats catalog trackers as their own observations. It does not average incompatible estimates or convert a provider’s consumer-spending figure into Alphabet revenue.
The public record does not settle three questions with a single current official number: total Google Play users, total apps in the catalog, and Google Play revenue separately recognized by Alphabet. It also does not provide enough shared methodological detail to reconcile the two 2025 download/install estimates or the two spending/revenue estimates above.
Quash has no first-party data covering Google Play marketplace statistics. That absence matters because no product telemetry can resolve the public gaps; a current official Google census or a clearly documented common measurement method would.
Conclusion
Google Play is large enough that a single number rarely describes the thing you need to know. Use Google’s own disclosures for payment readiness, subscriptions, and safety activity. Use third-party estimates only with their provider, metric, and year attached. Use Play Console when the question is about your app rather than the marketplace.
For your next deck, forecast, or release decision, choose the statistic that matches the decision first. That is more useful than forcing every Google Play measure into one total.
Continue reading
More articles from the Quash editorial desk.