
- Click Reports in the left navigation panel. The list shows all your runs, most recent first.
- Find the run you want to review. Use the filters at the top to narrow by type (Tasks / Suites) or result (Passed / Failed / All). Use the search bar to find a run by its prompt text.
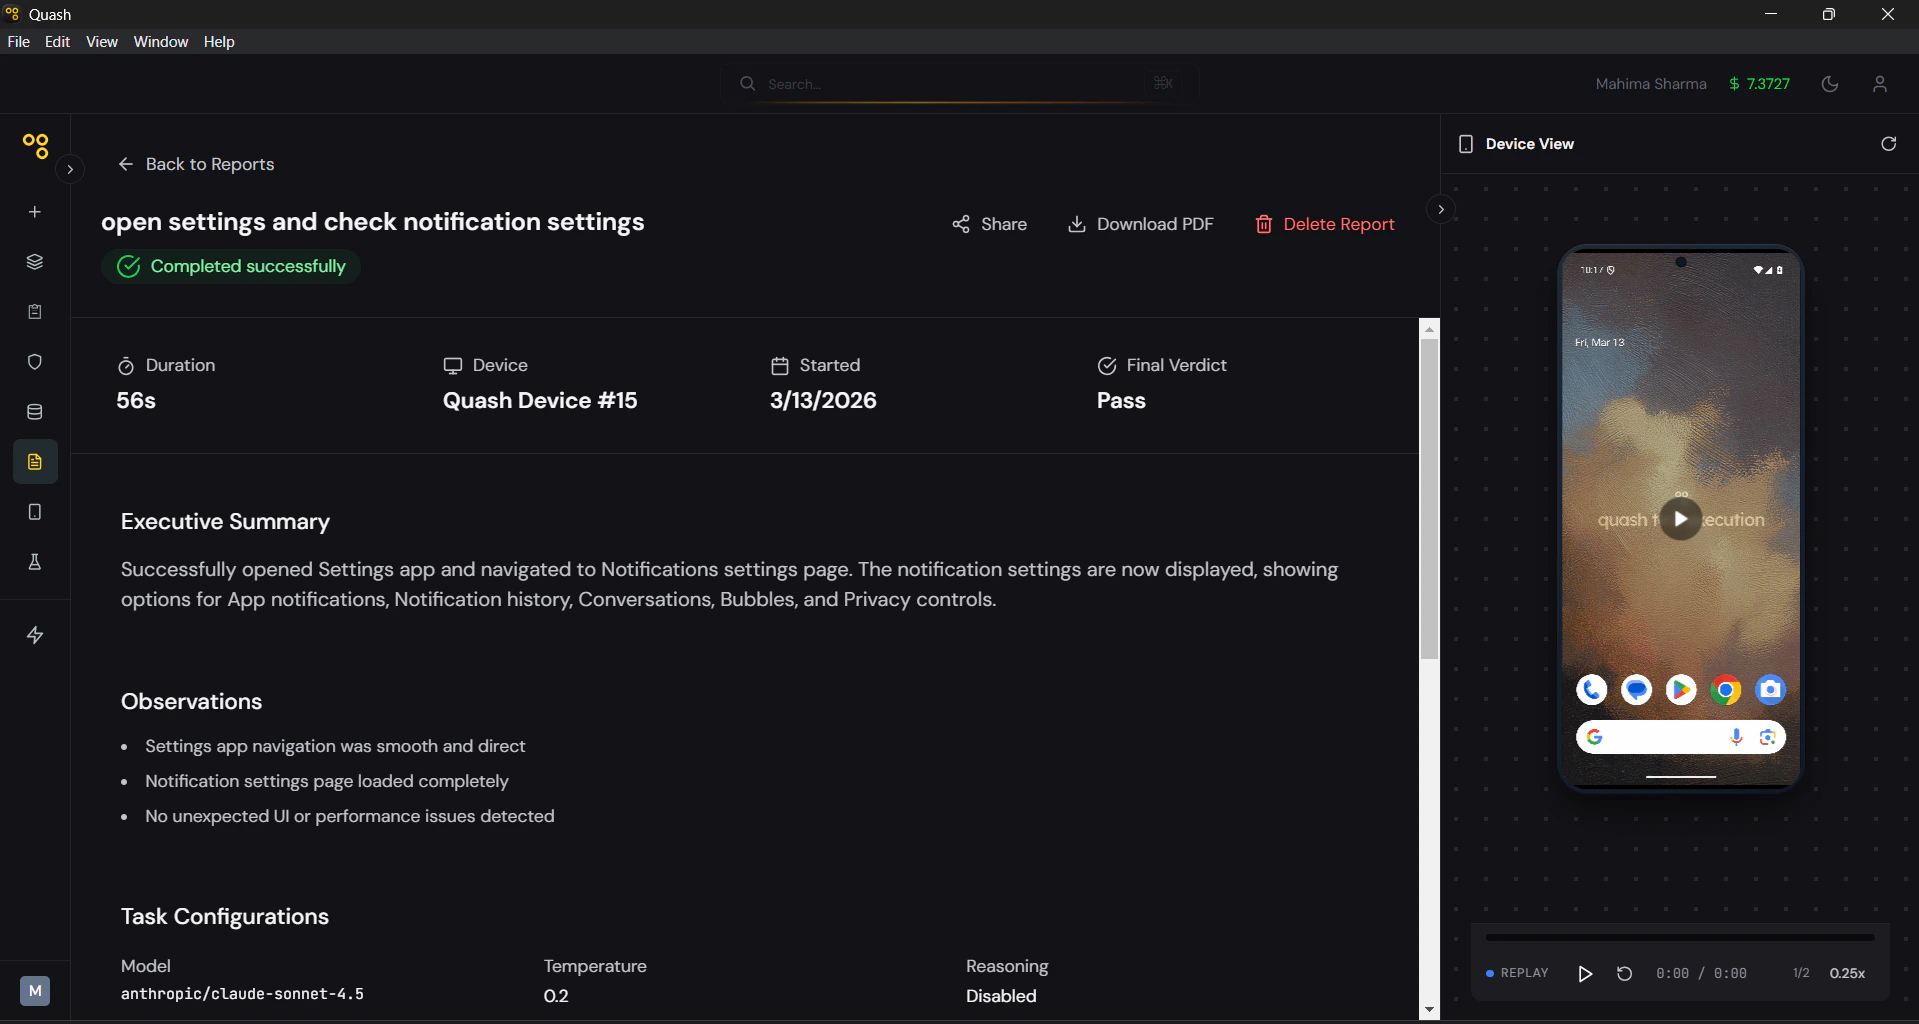
- Click the report to open it. The header shows four key details: Duration, Device, Started, and Final Verdict.
- Read the Executive Summary first. This is the AI’s plain-language account of the run — what it did, what it found, and where it stopped if it didn’t complete. In most cases, this paragraph alone will tell you whether you need to dig deeper.
- If the run failed or returned a Partial Success, go to Observations next. This is the most actionable section — a specific list of what the agent encountered during execution.
- Open the Detailed Test Case Report to see the full step-by-step breakdown.
- Use the Device View panel on the right to replay the screen recording.
- To share the report, click Share to generate a link anyone can open without logging in. To export it, click Download PDF for the full report with screenshots included.
Detailed Report View
Clicking a report opens the full detail view, which includes:- Summary Header — Duration, Device, Started, and Final Verdict at a glance.
- Executive Summary — A plain-language paragraph written by the AI describing what happened during the run.
- Observations — A list of specific findings from the run — steps that behaved unexpectedly, conditions that blocked completion, validations that were checked, performance notes, and recommendations to improve test coverage.
- Task Configurations — A record of the settings active when the task ran: AI model, temperature, whether reasoning was enabled, maximum steps, and timeout. Useful when comparing results across multiple runs.
- Execution Timeline — A timestamped log showing when the task was created, when execution started, and when it completed.
- Detailed Test Case Report — A step-by-step breakdown of the entire run grouped by screen.
- Device View — A screen recording of the device during the run.
- Run type — Indicates whether this was a first run or a rerun. For reruns, shows the number of LLM calls made versus skipped, giving a direct measure of how much time the stored path saved.
Detailed Test Case Report
The Detailed Test Case Report provides deep visibility into how each step was executed. For every step, Quash captures:- Intent — What the AI agent was trying to achieve at that step.
- Execution — The actual action taken by the agent (such as taps, scrolls, API calls, or system interactions).
- Interpretation — How the agent evaluated the result of the action.
- Duration — Time taken to complete the step.
- Screenshots — Visual snapshots captured during execution for context.