Android Profiling: Smooth 120fps Apps

The PawsConnect Performance Challenge
In 2019, I launched PawsConnect, a social media app for pet enthusiasts. Despite initial excitement, user feedback highlighted significant issues:
"App freezes during scrolling."
"Excessive battery drain."
"Uninstalled within minutes."
These challenges introduced me to the concept of "jank" — noticeable stutters in app performance. It was clear that optimization needed to take center stage.

Get the Mobile Testing Playbook Used by 800+ QA Teams
Discover 50+ battle-tested strategies to catch critical bugs before production and ship 5-star apps faster.
Essential Tools: Kotlin and Android Studio Profilers

Kotlin's powerful features and Android Studio's profiling tools are indispensable for optimizing performance.
CPU Profiler: Identifying Performance Bottlenecks
The CPU Profiler in Android Studio provides detailed insights into CPU utilization and thread activity, highlighting which threads are active, their operations, and CPU consumption. This helps pinpoint performance bottlenecks due to inefficient or complex code.
Trace-based vs. Sample-based Profiling: Choose trace-based for detailed insights into all method calls or sample-based for periodic snapshots with less overhead.
Thread Analysis: Essential for optimizing threading models, this analysis helps identify and resolve issues with long-running or blocked threads to enhance app responsiveness.
For Kotlin:
// Example of CPU-intensive operationfun processImage(bitmap: Bitmap): Bitmap {// Heavy image processingreturn processedBitmap}
Why it matters: CPU-heavy operations on the main thread lead to UI freezes and jank.
Case Study: Shifting image processing to a background thread in PawsConnect reduced frame drops by 70%.
For Kotlin:
// Optimized version using coroutinesfun processAndDisplayImage(bitmap: Bitmap) {viewModelScope.launch(Dispatchers.Default) {val processed = processImage(bitmap)withContext(Dispatchers.Main) {imageView.setImageBitmap(processed)}}}
Memory Profiler: Eliminating Leaks and Optimizing Usage
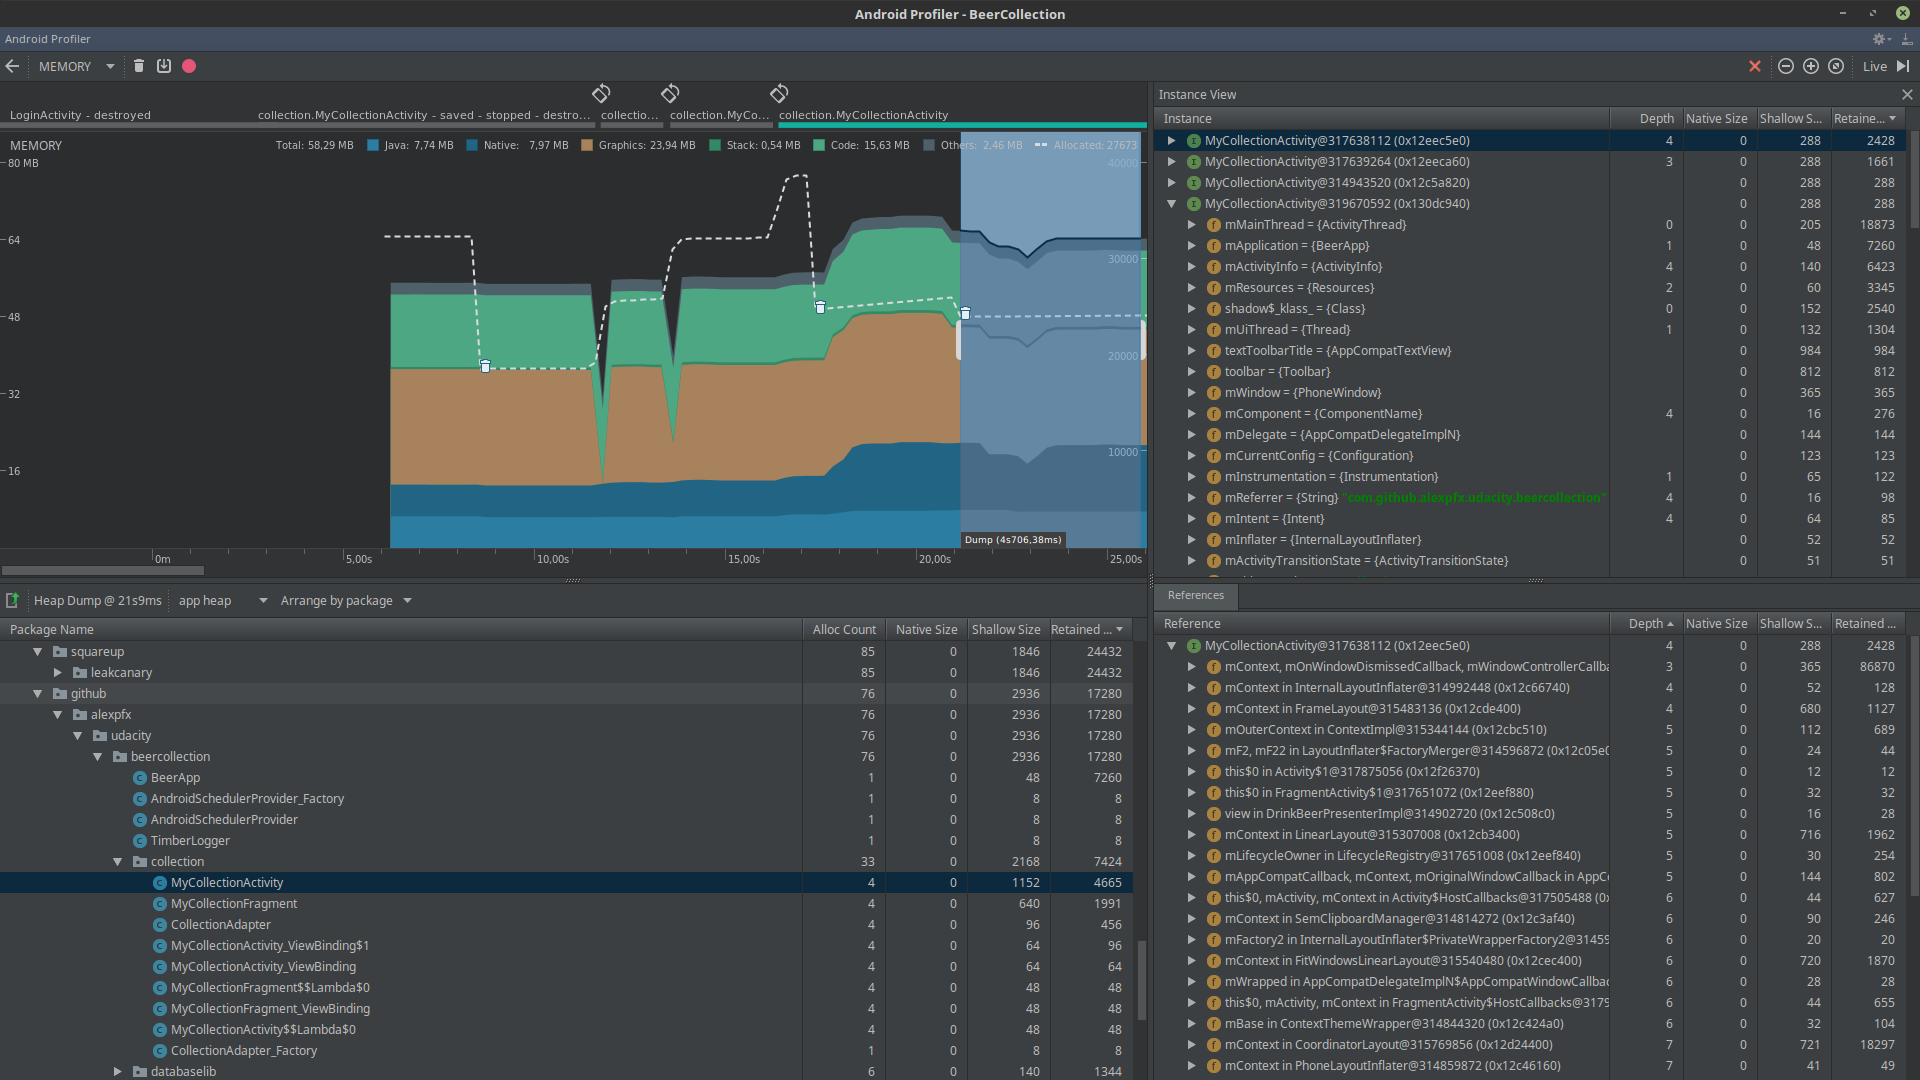
The Memory Profiler tracks object allocation and deallocation, offering a comprehensive view of app memory usage and helping identify memory leaks. Its insights are crucial for optimizing memory management, ensuring the app remains responsive and smooth.
Heap analysis: You can analyze the heap to see which objects are using up memory, helping to identify unnecessary data storage that can be minimized or optimized.
Garbage collection monitoring: The profiler shows garbage collection events, indicating potential issues like frequent collections due to excessive object creation. Optimizing code to reduce object churn can lead to smoother performance and decreased memory pressure.
For Kotlin:
class PotentialLeakyClass {companion object {// Potential leak: static view referencelateinit var leakyView: View}}
Why it matters: Memory leaks increase RAM usage, leading to frequent garbage collection and possible crashes.
Case Study: Fixing a memory leak in PawsConnect's image caching reduced memory usage by 30% and eliminated intermittent stutters.
Energy Profiler: Optimizing Battery Usage
The Energy Profiler helps you understand how their application impacts a device's battery life. It provides a timeline view that correlates battery consumption with other events, such as CPU activity, network usage, and location requests. This holistic view allows you to see how different parts of their application affect battery life and adjust their usage of system resources accordingly.
Energy consumption patterns: Identifying spikes in energy use can indicate areas where the application may be doing unnecessary work or misusing resources (e.g., excessive GPS usage or network activity in the background).
Optimization strategies: Based on profiling data, you can implement strategies to reduce energy consumption, such as deferring non-urgent network calls to periods when the device is charging or using more power-efficient APIs for location services.
For Kotlin:
// Example of efficient background task schedulingval jobScheduler = getSystemService(Context.JOB_SCHEDULER_SERVICE) as JobSchedulerval jobInfo = JobInfo.Builder(123, ComponentName(this, MyJobService::class.java)).setRequiresCharging(true).build()jobScheduler.schedule(jobInfo)
Why it matters: Efficient battery usage enhances user satisfaction and prevents Android from limiting app functionality.
Benchmark: Implementing WorkManager for background tasks in PawsConnect reduced battery consumption by 40% over 24 hours.
UI Performance Optimization Techniques
Optimizing the user interface is crucial for ensuring smooth app performance and enhancing user experience. This section dives into techniques for minimizing overdraw, optimizing RecyclerView, and leveraging Jetpack Compose for efficient UI development.
Minimizing Overdraw
Overdraw occurs when the app draws the same pixel more than once within a single frame. It's a common issue in Android apps that can significantly reduce rendering efficiency and drain battery life.
Strategies to Reduce Overdraw:
Use Layout Inspector: Android Studio's Layout Inspector tool helps identify and visualize areas of overdraw. By seeing exactly where overdraw occurs, developers can make informed decisions on how to simplify their UI layouts.
Flatten Layouts Using ConstraintLayout: Replacing nested view groups with ConstraintLayout helps flatten the layout hierarchy, significantly reducing overdraw. ConstraintLayout allows for complex layouts with a flatter view hierarchy, improving rendering performance.

Optimize Background Usage: Minimize the use of large and complex drawables as backgrounds, especially where they are covered by other views. Simple or solid color backgrounds are more efficient.
XML Example: Efficient Layout
<androidx.constraintlayout.widget.ConstraintLayoutandroid:layout_width="match_parent"android:layout_height="match_parent"><!-- Simplified child views reduce overdraw --></androidx.constraintlayout.widget.ConstraintLayout>
Why it matters: Overdraw wastes GPU resources, leading to dropped frames and reduced battery life.
Case Study: Flattening PawsConnect's main feed layout reduced overdraw by 60% and improved scroll performance by 25%.
RecyclerView Optimization
RecyclerView is a powerful component used to display large sets of data efficiently. Proper implementation and optimization of RecyclerView are key to achieving smooth scrolling experiences.
Optimization Techniques:
Implement DiffUtil: DiffUtil is a utility that helps your RecyclerView handle updates more efficiently. It calculates the differences between old and new lists, allowing updates to be processed with minimal effect on performance.
Optimize ViewHolders: Simplify ViewHolder implementations to reduce complexity and increase recycling efficiency. Avoid unnecessary view inflation and complex layout hierarchies within each item.
Simplify Item Layouts: Reducing the complexity of each item's layout directly contributes to better performance, especially during fast scrolling.
Kotlin Example: Efficient Adapter
class EfficientAdapter : ListAdapter<Item, EfficientViewHolder>(DIFF_CALLBACK) {override fun areItemsThe Same(oldItem: Item, newItem: Item) = oldItem.id == newItem.idoverride fun areContents TheSame(oldItem: Item, newItem: Item) = oldItem == newItem}
Why it matters: Proper RecyclerView usage is crucial for consistent list scrolling performance.
Benchmark: These optimizations in PawsConnect's main feed reduced frame render times by 40%, achieving consistent 120fps scrolling on high-end devices.
Jetpack Compose for Performance
Jetpack Compose is Android's modern toolkit for building native UIs using a declarative approach, which simplifies UI development and reduces the chance of bugs.
Performance Advantages of Jetpack Compose:
Efficient List Rendering: Utilize LazyColumn and LazyRow for list handling that only renders items visible on screen, significantly reducing resource usage.
Optimized Recomposition: Compose minimizes unnecessary UI updates by only recomposing parts of the UI that have changed.
Elimination of findViewById: Compose does not use findViewById, reducing overhead and speeding up UI rendering.
Kotlin Example: Efficient List Handling
@Composablefun EfficientList(items: List<Item>) {LazyColumn {items(items) { item ->ItemRow(item)}}}
Why it matters: Compose simplifies UI development while providing built-in performance enhancements.
Case Study: Transitioning a complex PawsConnect screen to Compose resulted in:
30% reduction in UI code
50% decrease in UI-related crashes
20% improvement in average frame render times
Key Strategies for Jank-Free Android Apps
Regular profiling
Layout optimization
Efficient memory management
Background task optimization
Efficient UI updates
Conclusion: Achieving 120fps Performance
Implementing these optimizations in PawsConnect produced significant results:
Frame rate increased from 45fps to consistent 110-120fps on high-end devices
App size reduced by 15%
30% decrease in battery usage during typical 30-minute sessions
Crash-free sessions improved from 95% to 99.5%
Consistent profiling, optimization, and continuous learning are essential to creating smooth Android apps that delight users and excel in the market.
Share your performance tips in the comments. Let's collaborate to elevate Android app performance together!


